Figure 6.

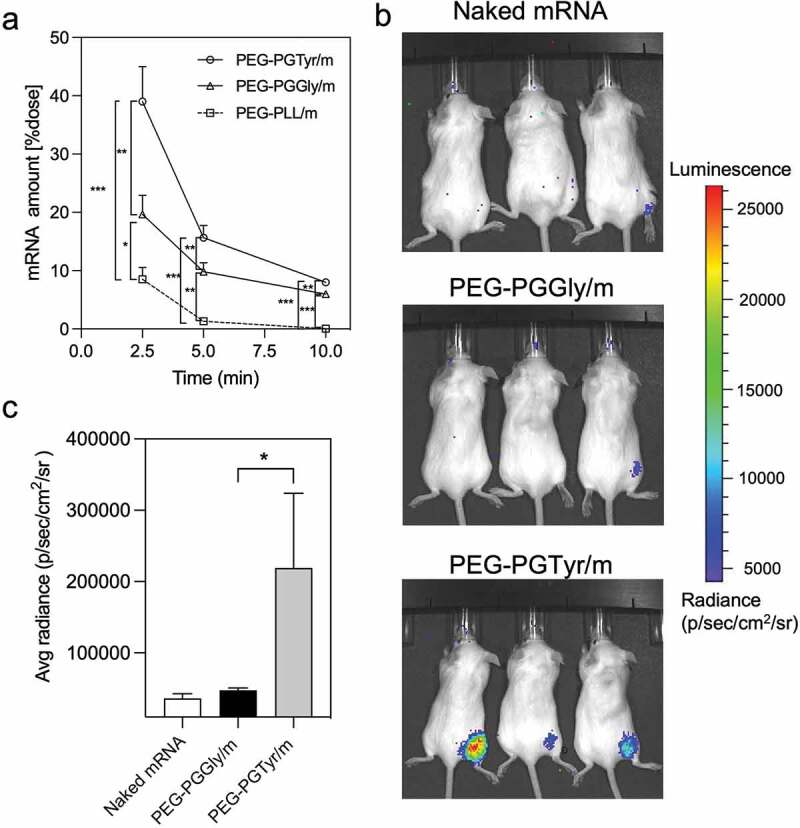
In vivo performance of mRNA-encapsulating micelles. (a) Remaining mRNA amount in the bloodstream of mice after intravenous injection of mRNA-loaded micelles containing 4 μg of mRNA. Data were shown as means ± S.D. (n = 5). Statistical significance was conducted using one-way ANOVA and Tukey’s post hoc tests. (b) Representative in vivo bioluminescence images 9 h after intramuscular injection of Fluc mRNA, PEG-PGGly/m and PEG-PGTyr/m (5 μg mRNA per mouse, n = 3). (c) Quantification of the luminescence signals from the images in b. Data were shown as means ± S.D. (n = 3). Statistical significance was conducted using a two-tailed Student’s t-test. The difference was considered statistically significant with *p < 0.05, **p < 0.01, ***p < 0.001, denoted with asterisks.
