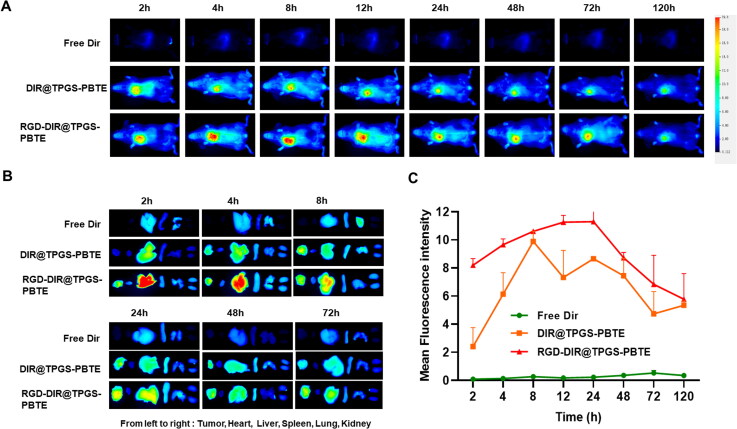
Figure 6.
In vivo pharmacokinetic and biodistribution study. (A) Fluorescence images of SCC-7 tumor-bearing mice after i.v. injection of free DIR, DIR@TPGS-PBTE, and RGD-DIR@TPGS-PBTE at different time intervals; (B) Fluorescence imaging of major organs and tumors at different time intervals. (C) Fluorescence intensity-Time profiles of free DIR, DIR@TPGS-PBTE, and RGD-DIR@TPGS-PBTE in SCC-7 tumor.

