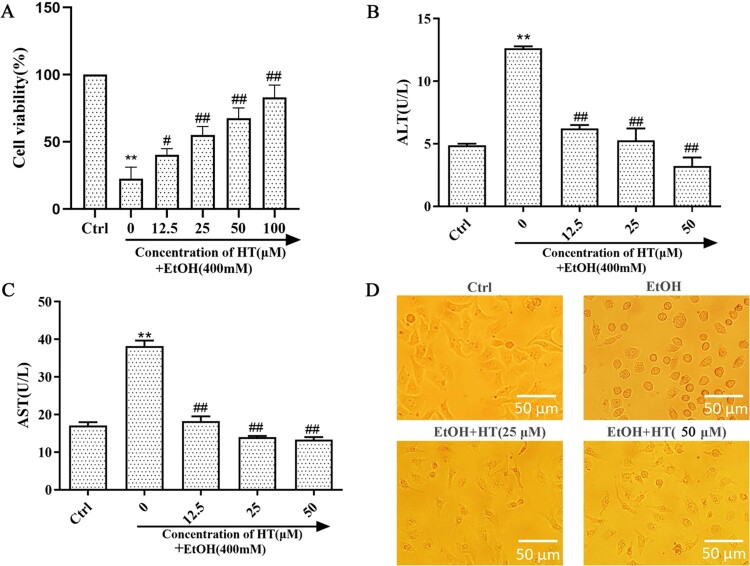
Figure 1.
Effects of HT on liver injury in ethanol-induced HepG2 cells. HepG2 cells were treated with 400 mM ethanol together with different concentrations of HT. (A) The cell survival rate of HepG2 cells was measured by MTT assay. (B, C) The levels of intracellular ALT and AST were measured. (D) Status of HepG2 cells were observed under the microscope. The data represented as mean ± SD and difference between groups are considered significant at P < 0.05. * Difference to the Ctrl group. # Difference to the EtOH group.

