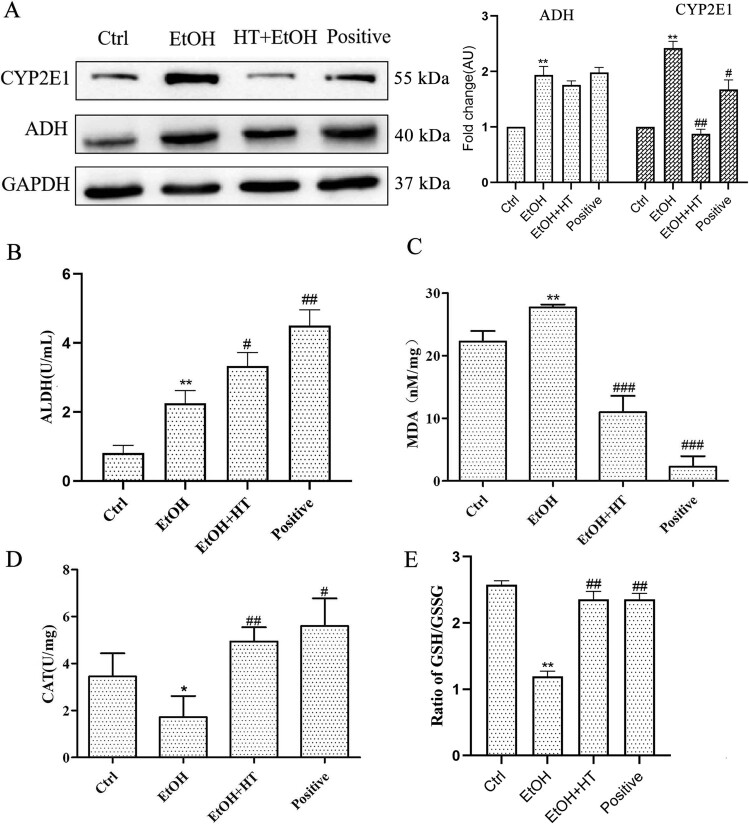
Figure 6.
Effects HT on hepatic steatosis and oxidative stress in chronic-binge ethanol-fed mice. (A) Western blot analysis of ADH and CYP2E1. Results were expressed as fold changes to control. (B) The level of serum ALDH was measured. (C–E) The levels of serum CAT activity, GSH/GSSG and MDA content were measured. Results were expressed as fold changes to control. The data represented as mean ± SD and difference between groups are considered significant at P < 0.05. * Difference to the Ctrl group. # Difference to the EtOH group.

