
Figure 1. Activation of WNT signaling by CHIR propagates and sustains EpiLCs as EpiLSCs with distinguished metabolism and differentiation potential.
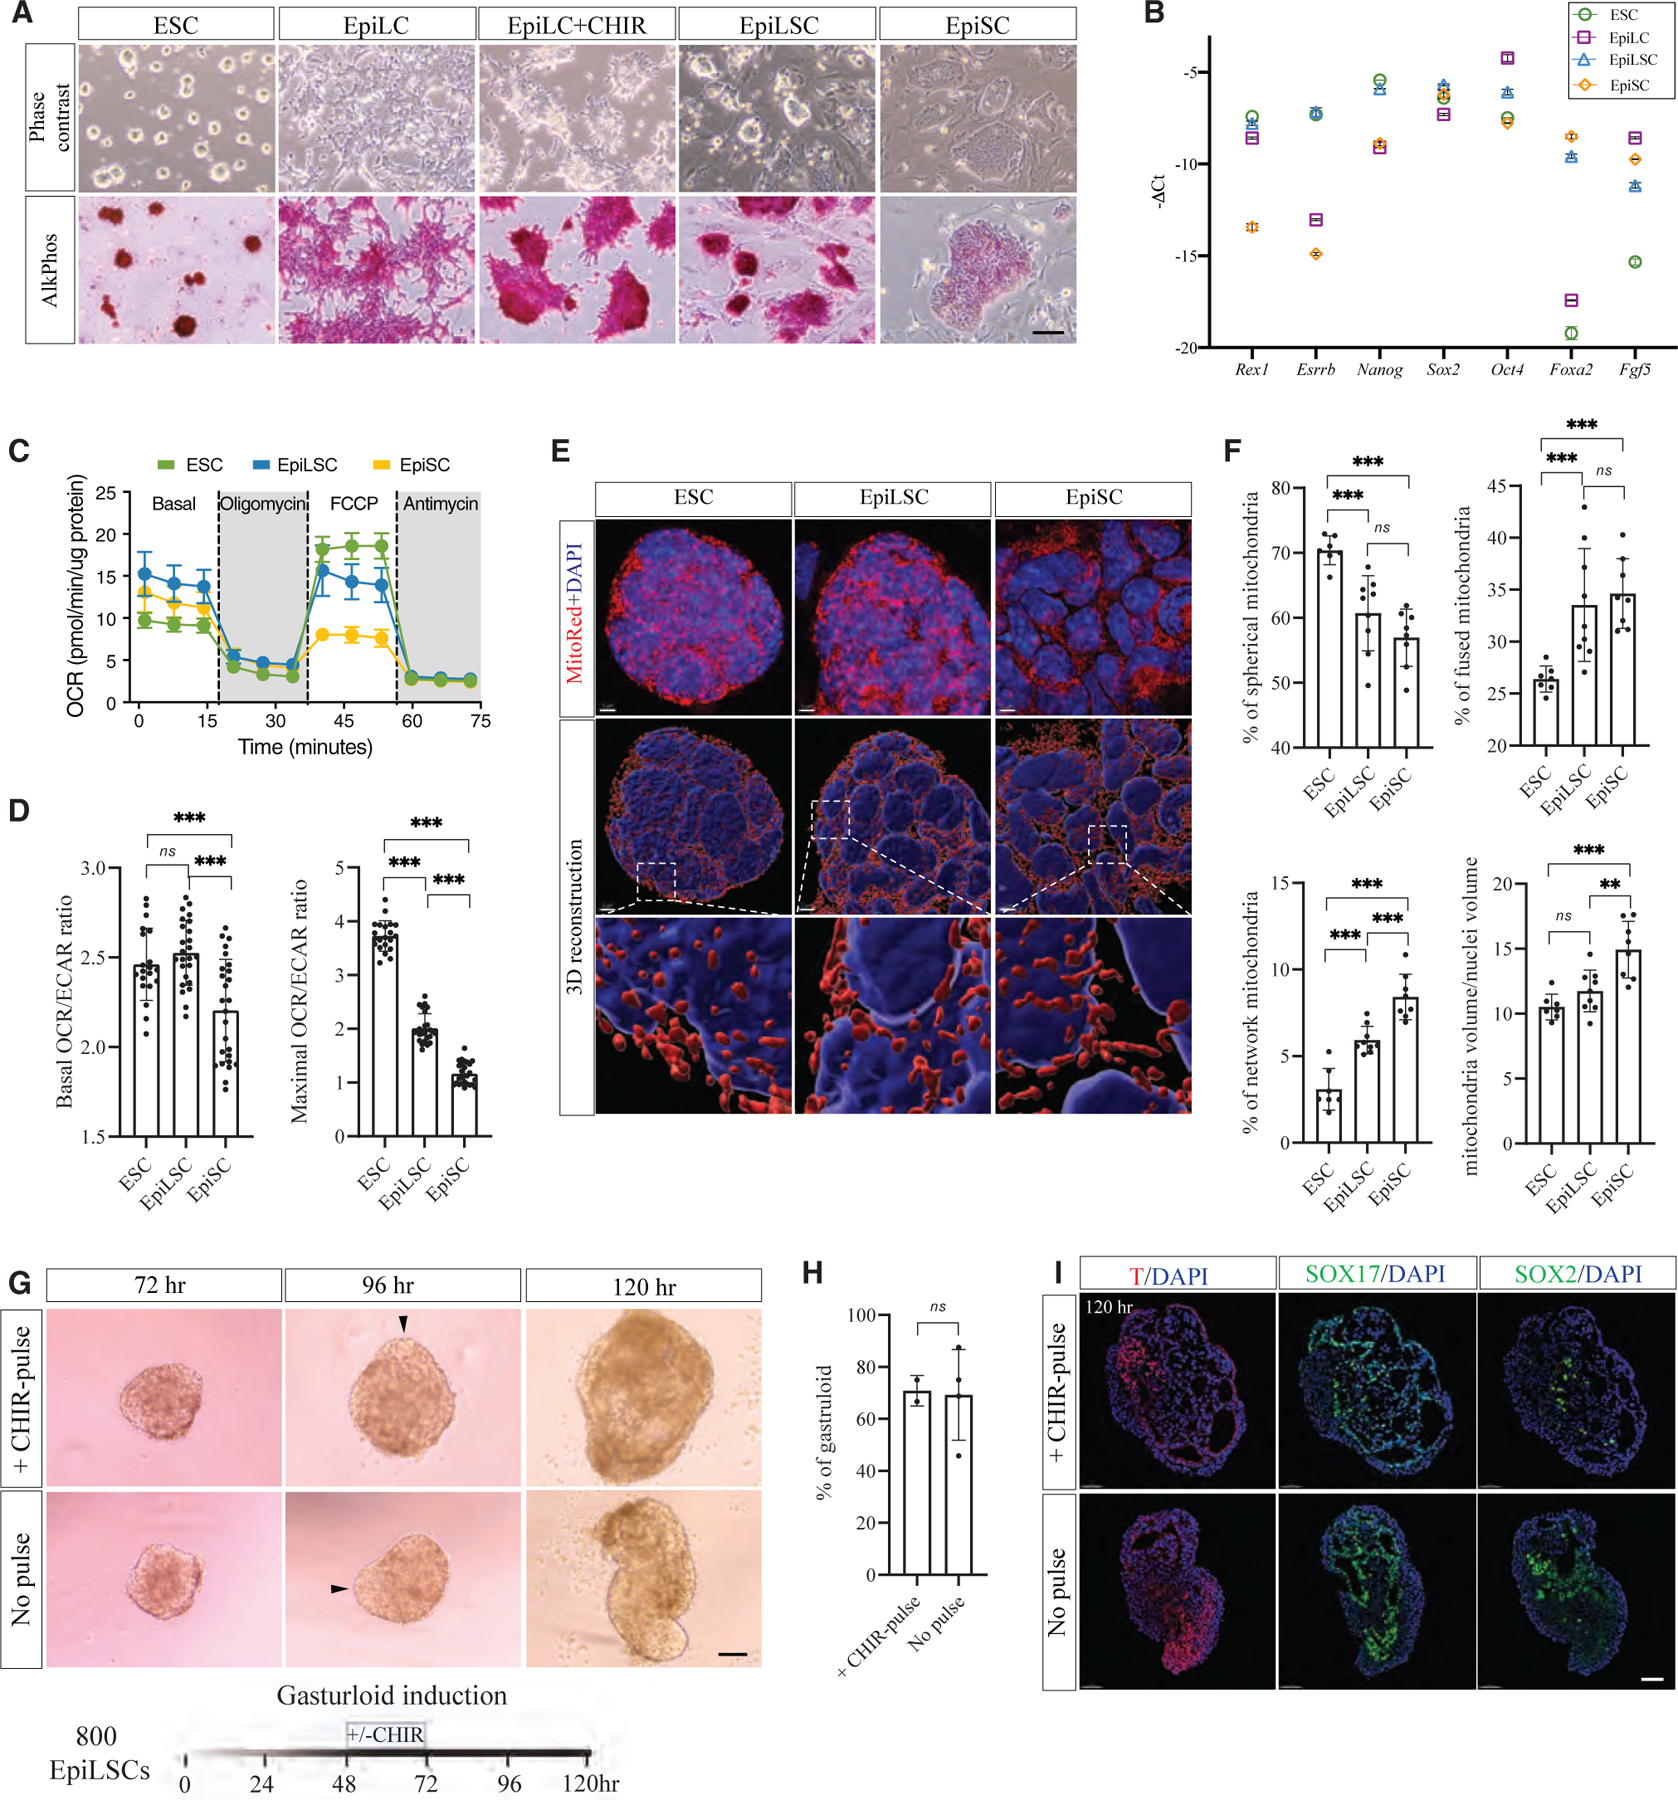
(A) Morphology of ESCs, day 2 EpiLCs, EpiLCs+CHIR (day 2), EpiLSCs, and EpiSCs shown by phase contrast and AP staining images. Scale bar, 100 μm.
(B) qRT-PCR in ESCs, day 2 EpiLCs, EpiLSCs, and EpiSCs.
(C and D) Extracellular flux analysis (Seahorse) of cellular respiration and OCR/ECAR ratio under basal and maximal conditions (D) in ESCs, EpiLSCs, and EpiSCs and (D) OCR/ECAR ratio under basal and maximal conditions. Error bars represent SD, ***p < 0.001; two-tailed Student’s t test.
(E) Immunofluorescent staining (top) and Imaris 3D renderings (bottom) of mitochondria in ESCs, EpiLSCs, and EpiSCs with MitoTracker Red. Nuclei were counter-stained with DAPI. Scale bar, 5 μm.
(F) Quantitative analyses of mitochondrial morphology and relative mitochondria volume. Error bars represent SD; ***p < 0.001, **p < 0.01; two-tailed Student’s t test.
(G) Bright-field images of EpiLSCs undergoing gastruloid assay using 800 cells with/without CHIR pulse. Arrowheads indicate protrusion zone. Scale bar, 100 μm.
(H) The percentage of EpiLSC embryoid bodies with symmetry breaking with/without CHIR pulse at 120 h. Error bars represent SD; ns: non-significance by two-tailed Student’s t test.
(I) Immunostaining of 120 h gastruloid derived from EpiLSCs using 800 cells with/without CHI -pulse at 48 h. Mesodermal, endodermal, and ectodermal cells are distinguished by T, SOX17, and SOX2 expression, respectively. Nuclei were counterstained with DAPI. Scale bar, 50 μm.
See also Figure S1.