
Figure 2. EpiLSCs show distinct chromatin accessibility associated with formative pluripotency and germline potency.
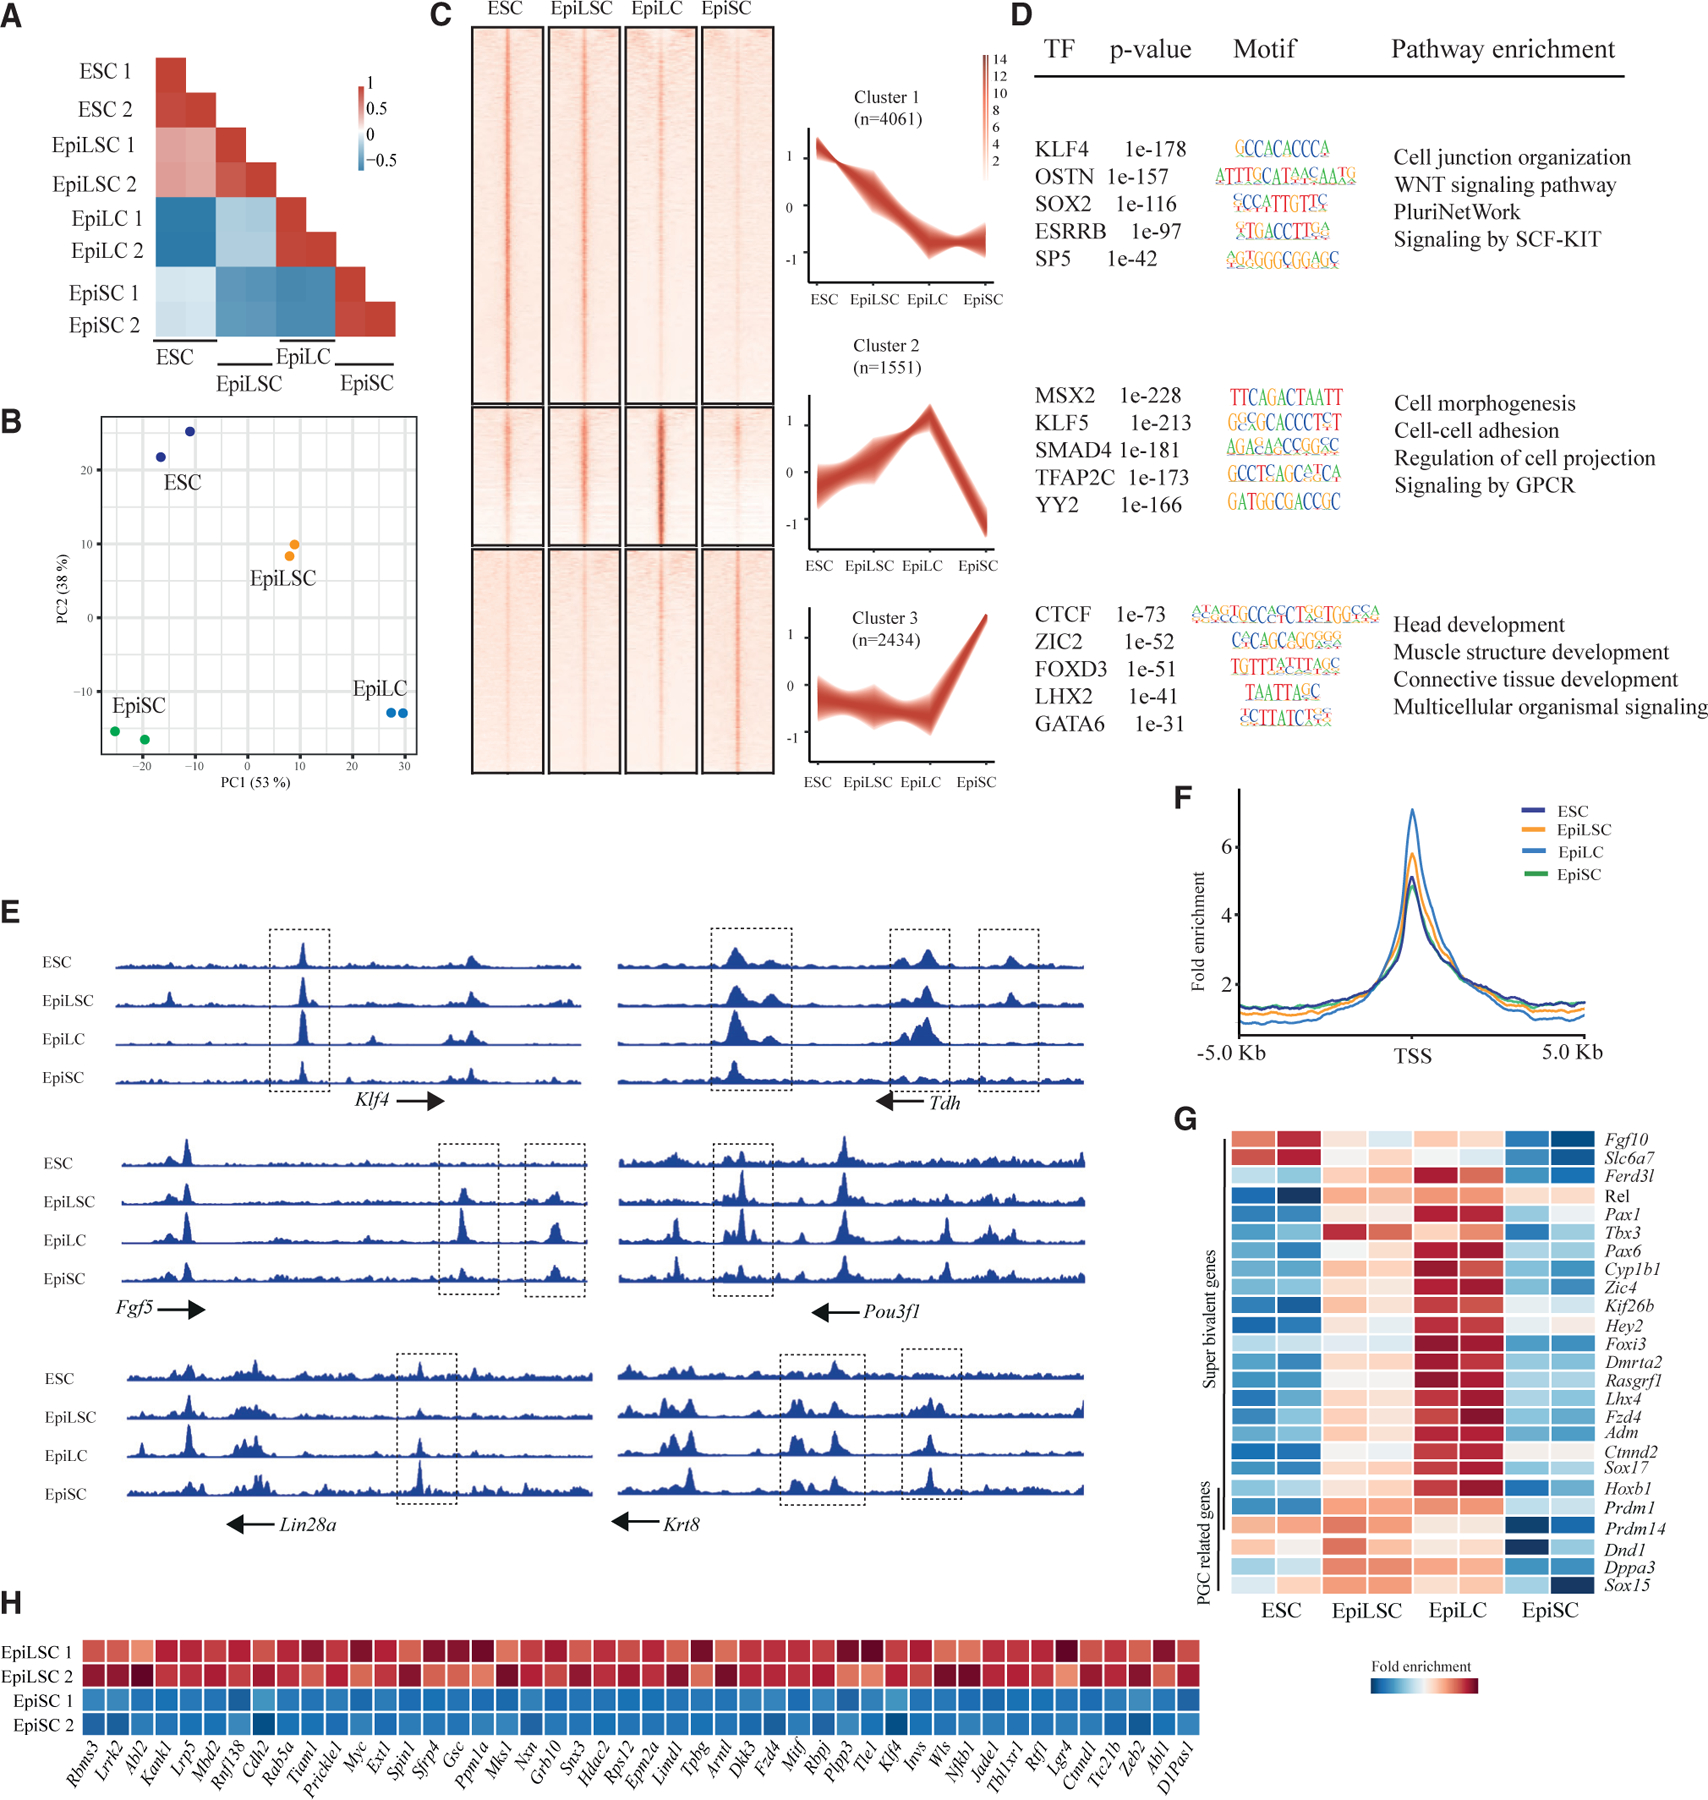
(A) Correlation heatmap of ESCs, EpiLSCs, EpiLCs, and EpiSCs. Label 1 and 2 means two replicates.
(B) PCA plot of ESCs, EpiLSCs, EpiLCs, and EpiSCs. Each cell line has two replicates as shown with the two dots.
(C) Left: heatmap of the three clusters of differential peaks in ESCs, EpiLSCs, EpiLCs, and EpiSCs. 2 kb flanking regions were included. Right: scaled value of the peaks showing different trend in the three clusters; n stands for peak number.
(D) Enriched motif and pathway of the three clusters of differential peaks.
(E) Track plot of ATAC-seq openness at the selected loci.
(F) Average openness of the TSS regions of super-bivalent genes. Flanking regions of 10 kb were included.
(G) Heatmap of scaled ATAC-seq normalized counts in the TSS regions of the selected genes. The genes were annotated as super-bivalent and PGC-related genes.
(H) Heatmap of scaled ATAC-seq normalized counts of EpiLSCs and EpiSCs in TSS regions of Wnt pathway-related genes.