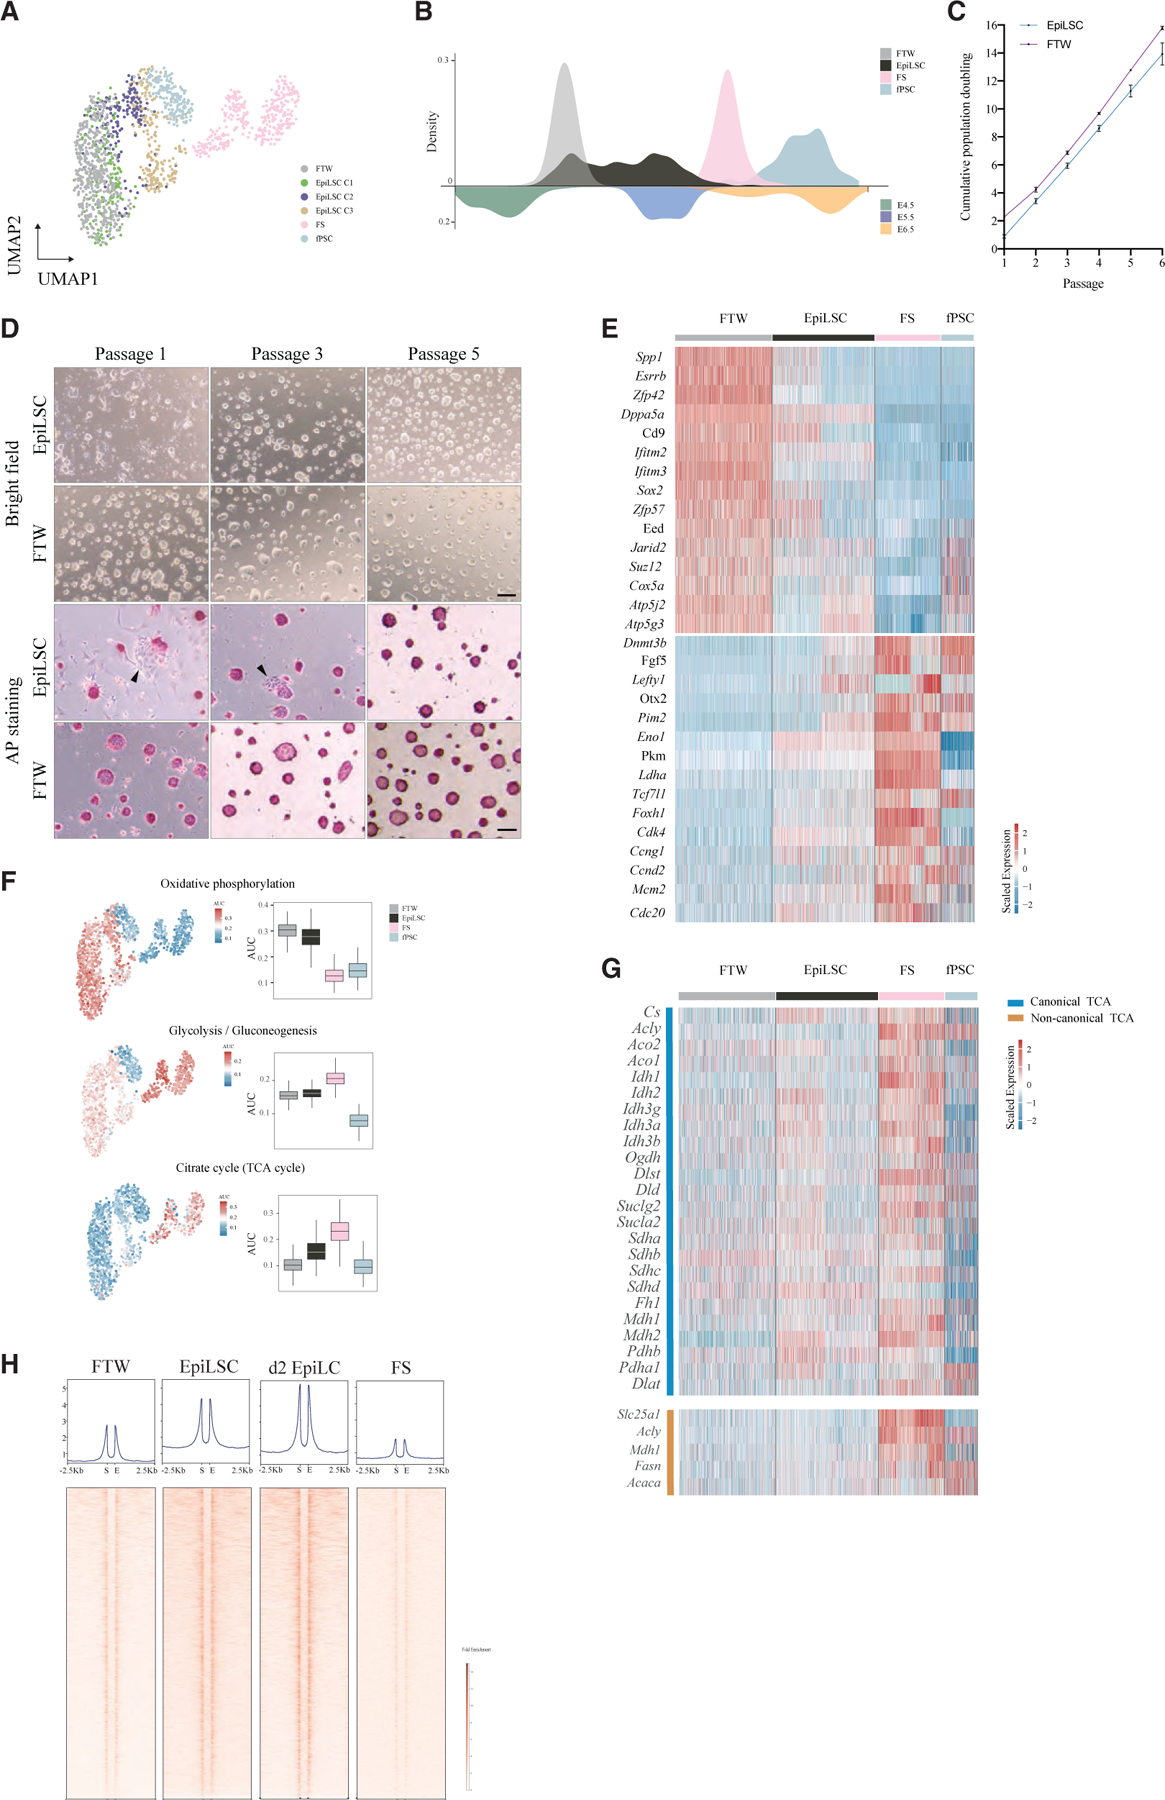
Figure 4. Comparison of EpiLSCs with other formative PSCs.

(A) UMAP embedding of EpiLSCs with FTW cells, FS cells, and fPSCs.
(B) Aligning formative PSCs in (A) to the E4.5–6.5 epiblasts by scSTALT.
(C) Cumulative population doubling of FTW cells and EpiLSCs during adaptation in 2i+LIF medium.
(D) Morphology of FTW-ESCs and EpiLSCs during their adaptation in 2i+LIF medium shown by phase contrast (scale bar, 200 μm) and AP staining (scale bar, 100 μm) images. Arrowheads indicate differentiated colonies.
(E) Heatmap showing the expressions of the selected consecutively downregulated genes (FTW cells > EpiLSCs > FS cells) and upregulated genes (FTW cells < EpiLSCs < FS cells).
(F) Metabolic pathway transcriptional activity inferred by scMetabolism shown in the same UMAP as in (A) (left) and in bar plot (right).
(G) Heatmap showing the gene expressions of canonical and non-canonical TCA cycle genes in FTW cells, EpiLSCs, FS cells, and fPSCs.
(H) ATAC-seq openness of FTW cells, EpiLSCs, day 2 EpiLCs, and FS cells in PRC2 insulators showing by metagene profile plot (top) and heatmap (bottom). S and E stand for the starting and ending sites of the insulator region, respectively. 5 kb flanking regions were included.
