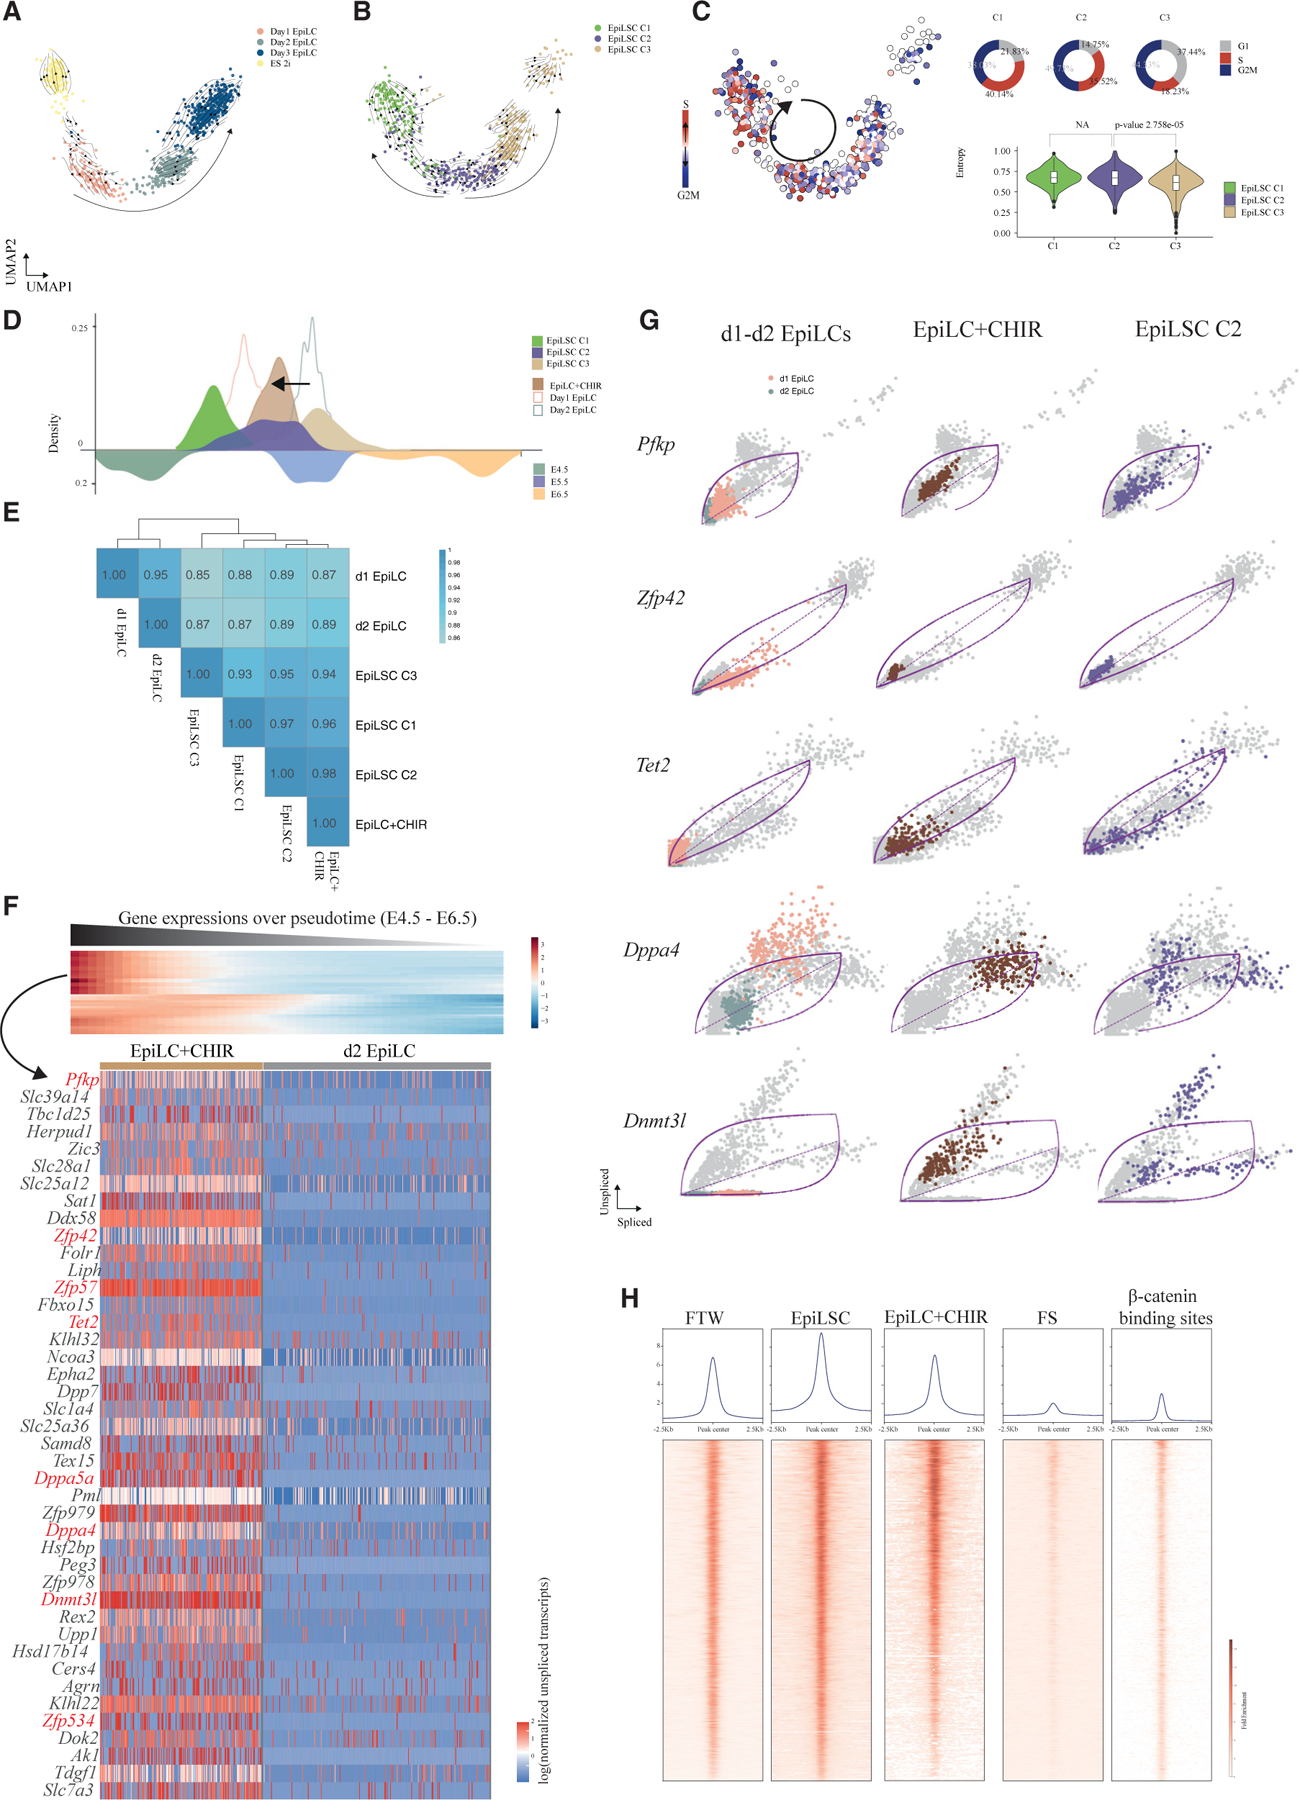
Figure 5. WNT/β-catenin signaling sustains dynamic cell states in EpiLSCs to maintain the formative pluripotency.

(A and B) Velocities of ESCs and day 1–3 EpiLCs (A) and C1–C3 EpiLSCs (B).
(C) Cell-cycle score presented in the same scSTALT embedding as in (B) (left). Cell-cycle phase distribution and cell entropies were presented cluster-wise in the pie chart (right).
(D) Pseudotime projection of EpiLCs+CHIR compared with day 1–2 EpiLCs and EpiLSCs.
(E) Spearman correlation matrix of the expression profile of day 1–2 EpiLCs, C1–C3 EpiLSCs, and EpiLCs+CHIR.
(F) CHIR increases the expression potential of the 42 driver genes. The inferred driver genes were expressed in the early phase during E4.5–6.5 trajectory (top), and their unspliced/spliced ratios in EpiLC+CHIR are higher than those in day 2 EpiLCs (bottom).
(G) Velocities of the selected genes in day 1–2 EpiLCs, EpiLCs+CHIR, and C2 EpiLSCs.
(H) ATAC-seq openness of FTW cells, EpiLSCs, day 2 EpiLCs+CHIR, and FS cells in the β-catenin binding sites shown by metagene profile plot (top) and heatmap (bottom). 5 kb flanking regions were included.
See also Figure S5.
