
Figure 2.
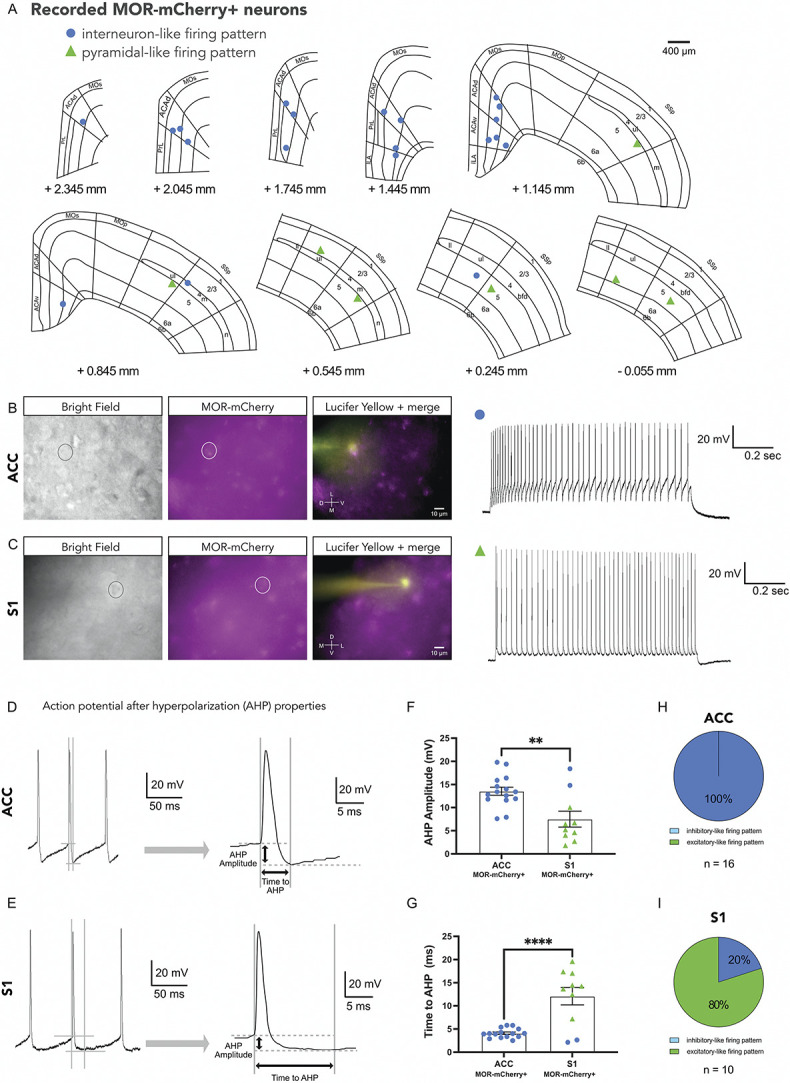
Distinct electrophysiological properties of MOR-mCherry+ neurons in ACC and S1. (A) Mouse brain atlas showing location of recorded MOR-mCherry+ neurons. (B) Representative images of MOR-mCherry tissue in bright field view (left panel), MOR-mCherry signal (middle panel), recorded neuron, and pipette (right panel). Visualization and current clamp trace of a MOR-mCherry+ neuron in ACC in response to 100 pA current pulse. (C) Visualization and current clamp trace of MOR-mCherry+ neuron in S1 in response to 100 pA current pulse. (D) Typical action potential properties, specifically after-hyperpolarization potential (AHP) amplitude, and time to AHP measured from action potential initiation point, in MOR-mCherry+ interneuron-like in ACC, and (E) in MOR-mCherry+ pyramidal-like firing pattern in S1. (F) Quantification of AHP amplitude. In ACC, MOR-mCherry+ neurons have significantly larger AHP (13.54 ± 0.89 mV) compared with S1 (7.50 ± 1.73 mV), t(23) = 3.399, P = 0.0025. (G) Quantification of time to AHP. In ACC, times to AHP of MOR-mCherry+ (4.10 ± 0.26 ms) are shorter compared with S1 (12.11 ± 1.91 ms), t(23) = 5.073, P < 0.0001. ACC MOR-mCherry+ group (n = 16 cells, 10 mice) and S1 MOR-mCherry+ group (n = 10 cells, 7 mice). Recordings were performed in male mice. Proportions of inhibitory and excitatory neuron firing patterns in ACC (H) and S1 (I). Data are presented as mean ± SEM with dots show individual neurons, **P < 0.01; ****P < 0.0001. MORs, mu opioid receptors.