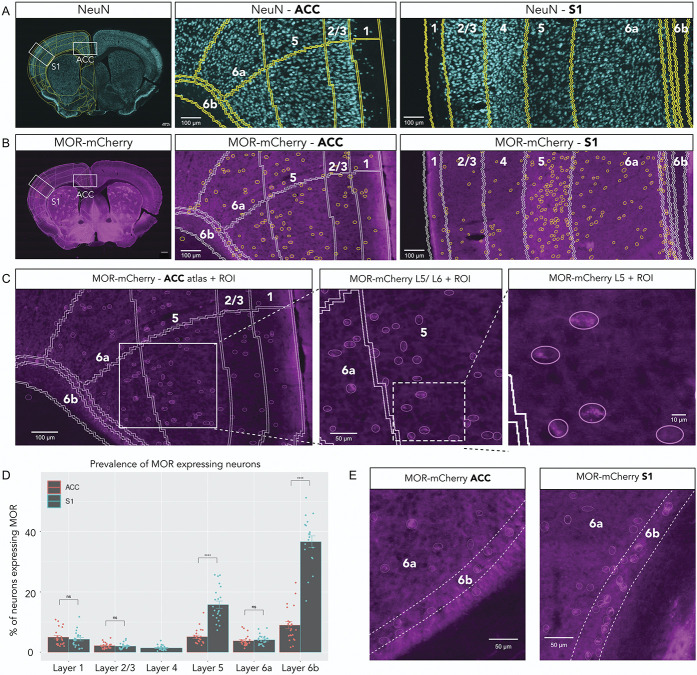
Figure 3.
Differences in MOR-mCherry expression pattern between ACC and S1. (A) NeuN pan-neuronal staining of whole mouse brain (left), ACC (middle), and S1 (right). Mouse brain atlas is overlaid. (B) MOR-mCherry expression using anti-mCherry staining of whole mouse brain (left), ACC (middle), and S1 (right). Atlas overlay in white. Yellow circles are outlining MOR-mCherry+ neurons. (C) Increasing magnifications of MOR-mCherry staining showing the MOR-mCherry+ neuron selection process. (D) Quantification of MOR-mCherry+ neurons over total number of neurons. Two-way mixed ANOVA F(1.98, 35.66) = 191.38, P < 0.0001. Pairwise comparisons using Wilcoxon signed rank test. (E) Typical MOR-mCherry staining in ACC L6b (left) and S1 L6b (right). Pooled male group (n = 12 sections, 3 mice) and female group (n = 10 sections, 3 mice). Data are presented as mean ± SEM, with dots showing individual data points, ****P < 0.0001. MORs, mu opioid receptors.

