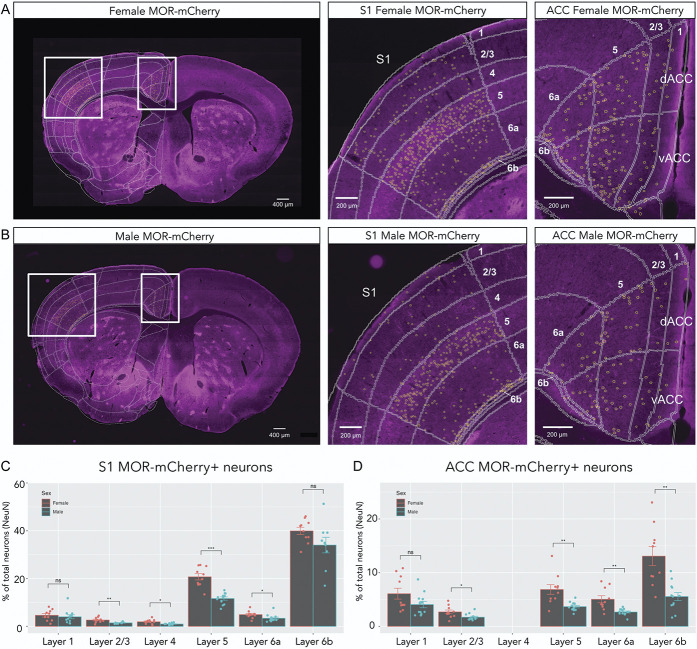
Figure 6.
Sex differences in MOR expression between ACC and S1. (A) Representative images from a female MOR-mCherry mouse, whole brain (left), higher magnification of S1 (middle), and ACC (right) areas. Mouse brain atlas overlaid in white, and MOR-mCherry ROIs shown as yellow circles. (B) Representative images from a male MOR-mCherry mouse, whole brain (left), S1 (middle), and ACC (right). (C) Quantification of MOR-mCherry expression in S1 comparing female (n = 10 sections, 3 mice) and male mice (n = 12 sections, 3 mice). Two-way mixed ANOVA F(5,117) = 5.42, P < 0.001. (D) Quantification of MOR-mCherry expression in male and female ACC. Two-way mixed ANOVA F(4,100) = 5.51, P < 0.001. Wilcoxon signed rank test. Data are presented as mean ± SEM. *P < 0.05, **P < 0.01, ***P < 0.001. MORs, mu opioid receptors.

