Figure 3.

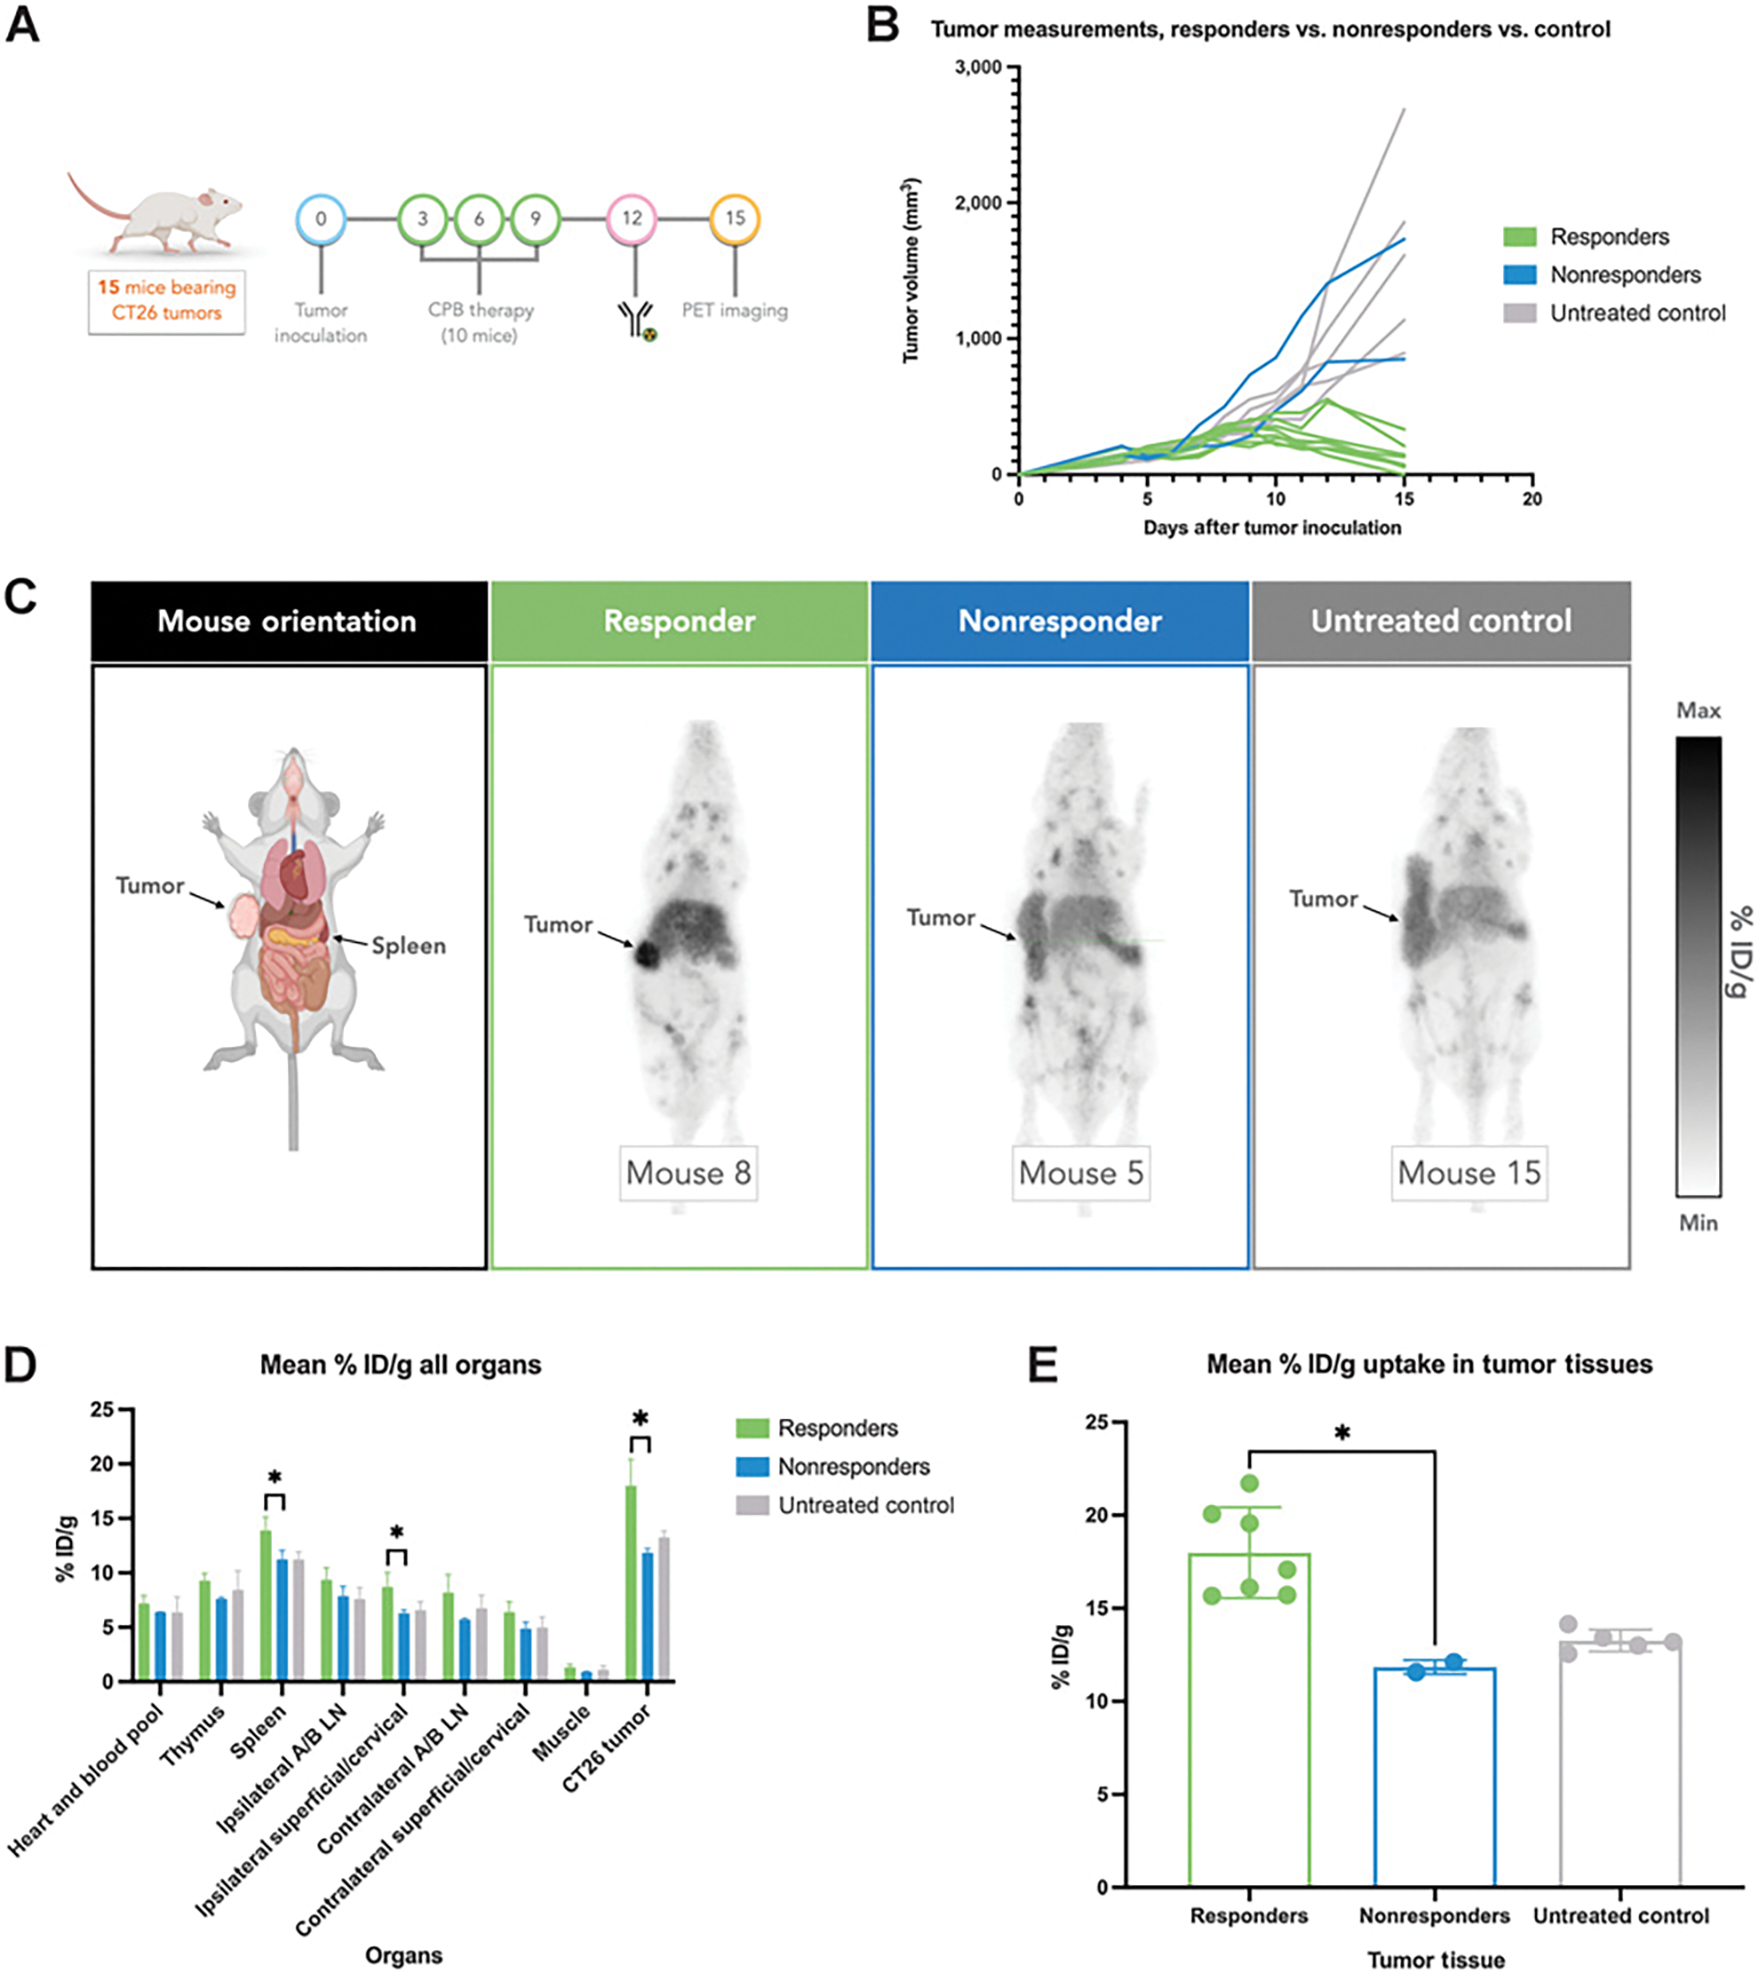
Quantifying [89Zr]-DFO-H1.2F3 in vivo using PET imaging in a CT26 syngeneic tumor immunotherapy model. A, Study design of 15-day PET imaging study for monitoring immune cell activation. B, Tumor growth monitoring by volume per mouse. C, Representative PET images taken 72 hours after intravenous injection of [89Zr]-DFO-H1.2F3 mAb of responder (n = 8), nonresponder (n = 2), and untreated (n = 5) groups, 72 hours postinjection. D, PET ROI quantification of [89Zr]-DFO-H1.2F3, in mean % ID/g, for major organs, including tumor tissues for each group. E, PET ROI quantification of [89Zr]-DFO-H1.2F3, in mean % ID/g, for tumors only. Two-tailed unpaired t test was used to compare groups., P < 0.05;, P < 0.01;, P < 0.001; Max, maximum; Min, minimum; NS, not significant; Ipsilateral A/B LN, ipsilateral axillary and brachial lymph nodes; Contralateral A/B LN, contralateral axillary and brachial lymph nodes.
