
Figure 4:
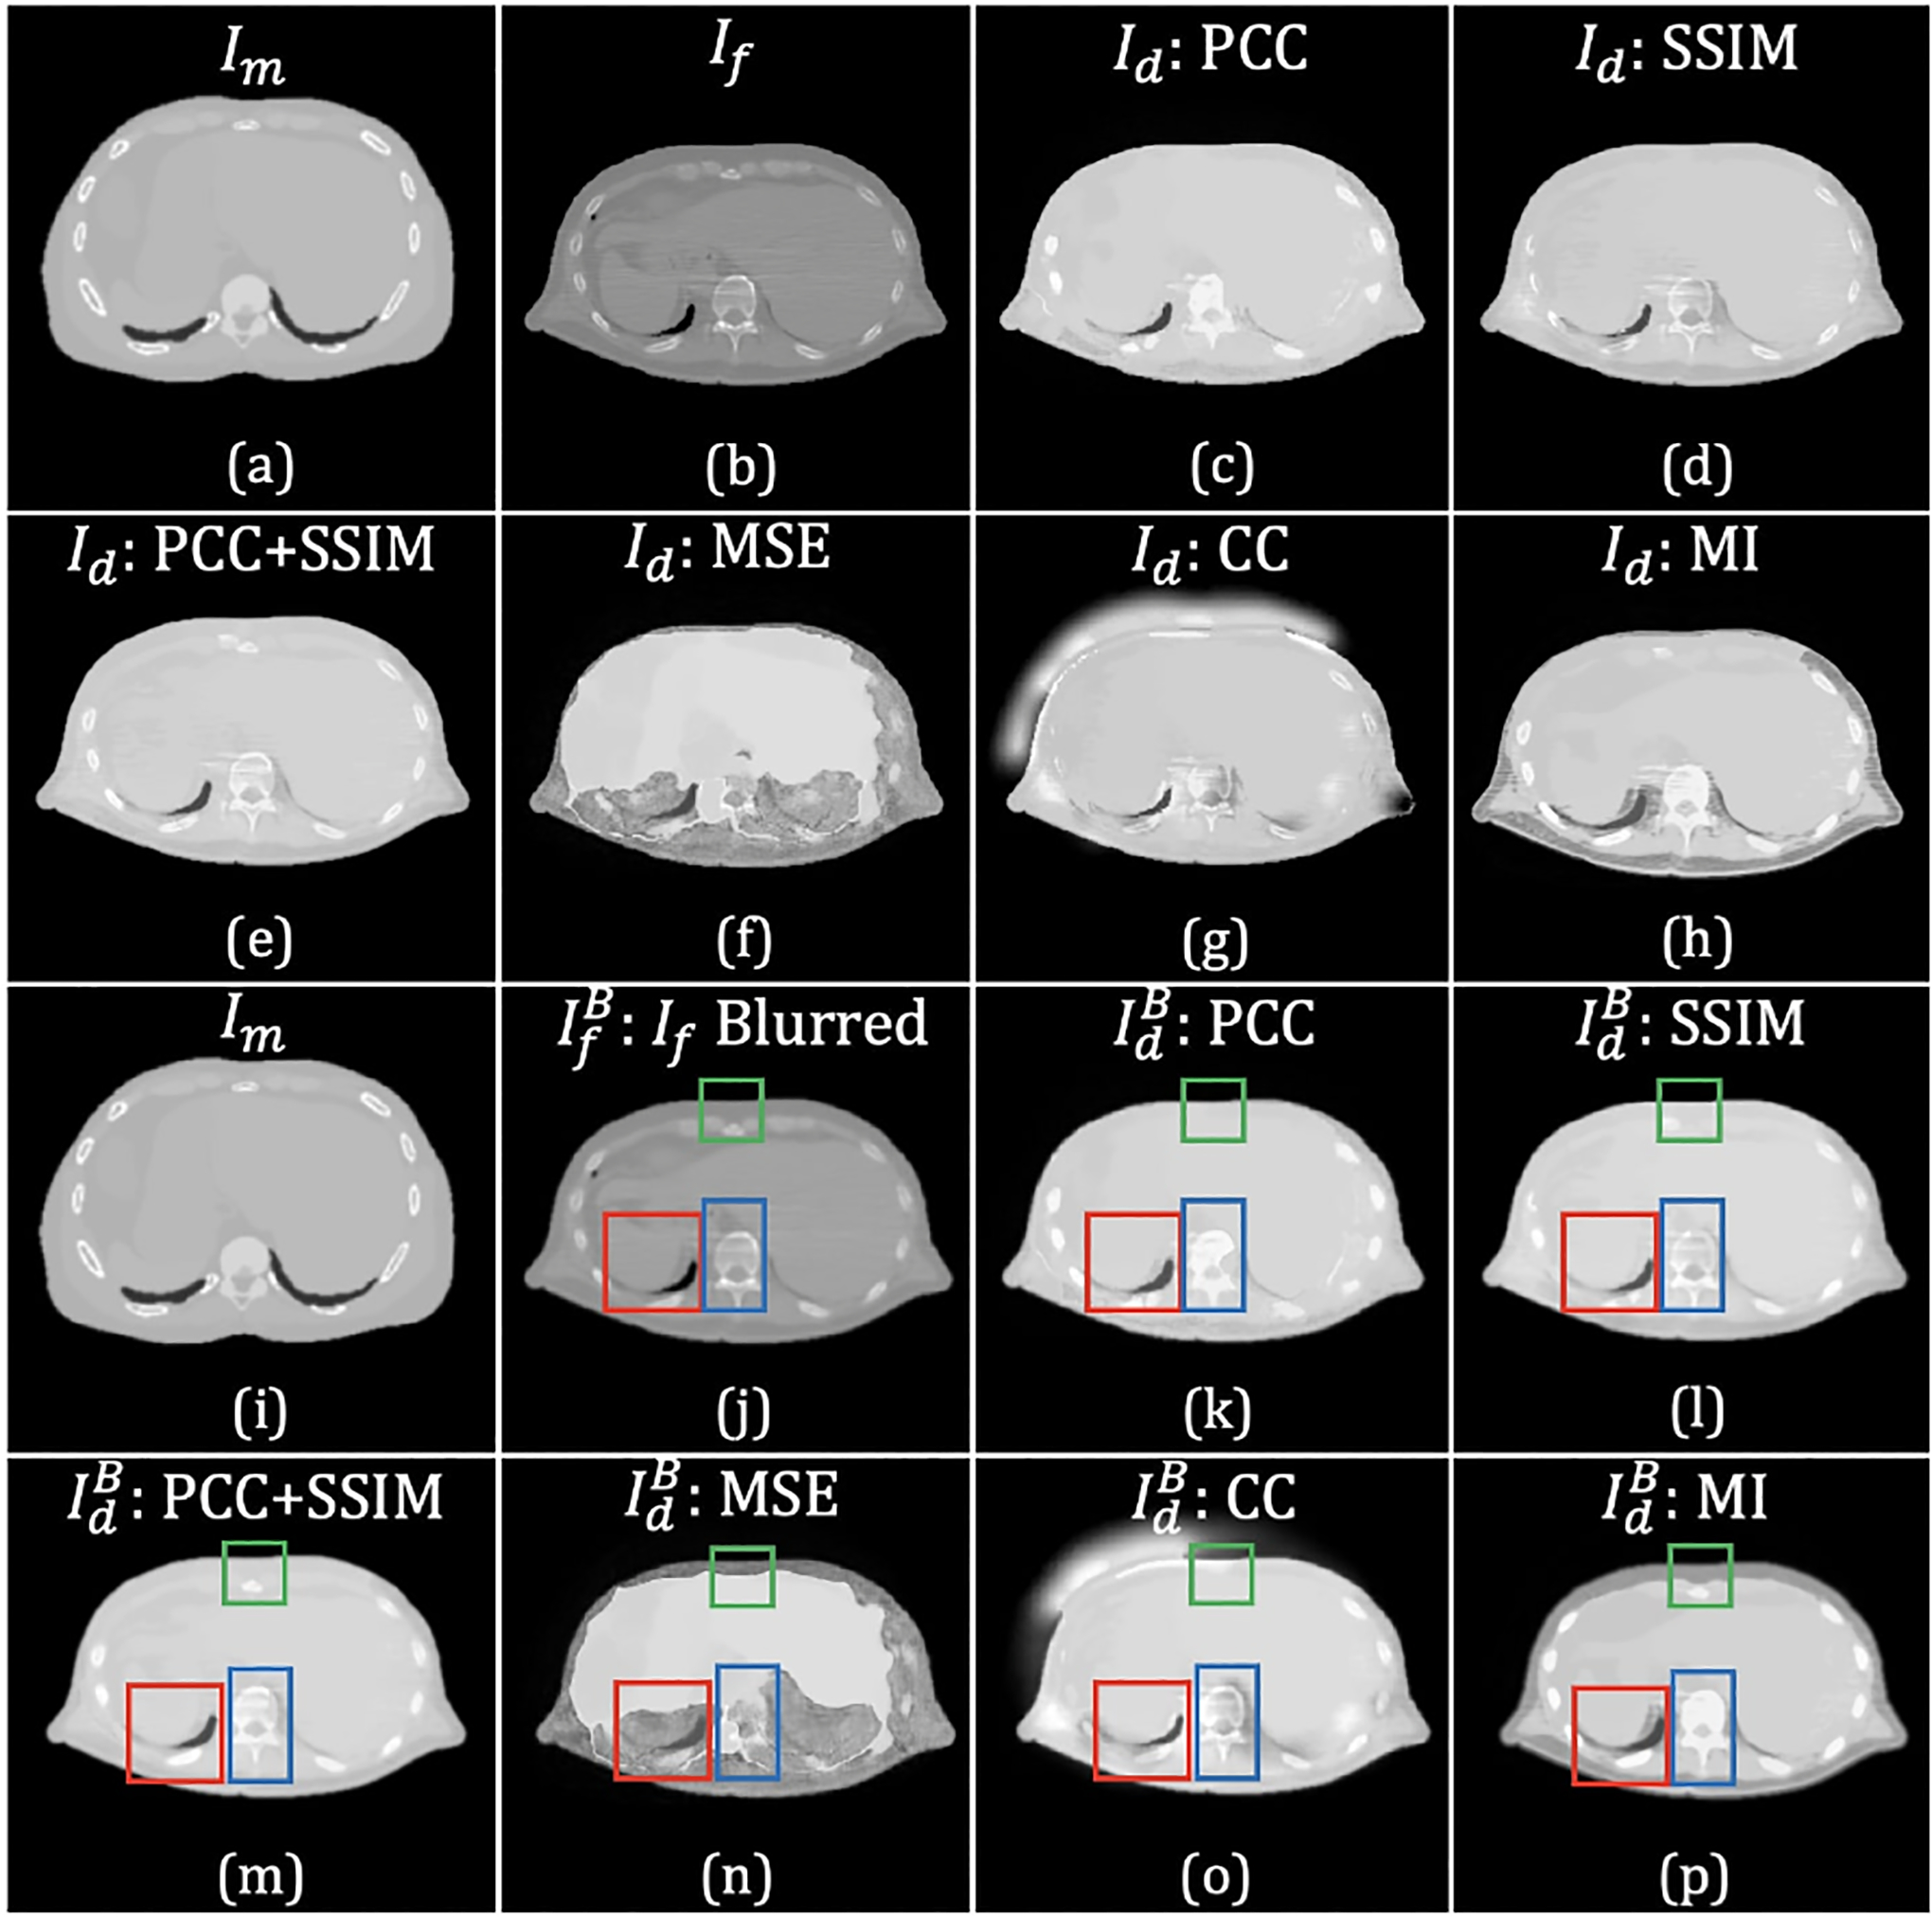
In comparing registered XCAT attenuation map images generated using different loss functions (without any regularization), some differences are highlighted by colored rectangles. The top two rows show the results generated without pre-filtering the fixed image; the bottom two rows show the results generated using the pre-filtered fixed image. The images in (a) and (i) exhibit the same slice of the attenuation map generated from the XCAT phantom, which served as the moving image, Im; (b) and (j) are the same patient CT images, but prior to use in the registration. Image (j) is (b) blurred with Gaussian filter (σ = 0.8) to reduce noise and artifacts. The images in (b) and (j) were used as the fixed image, If. Images shown in (c)-(h) and (k)-(p) resulted from applying the ConvNet using 6 different loss functions: (c) and (k) PCC; (d) and (l) SSIM; (e) and (m) PCC+SSIM; (f) and (n) MSE; (g) and (o) CC; and (h) and (p) MI.