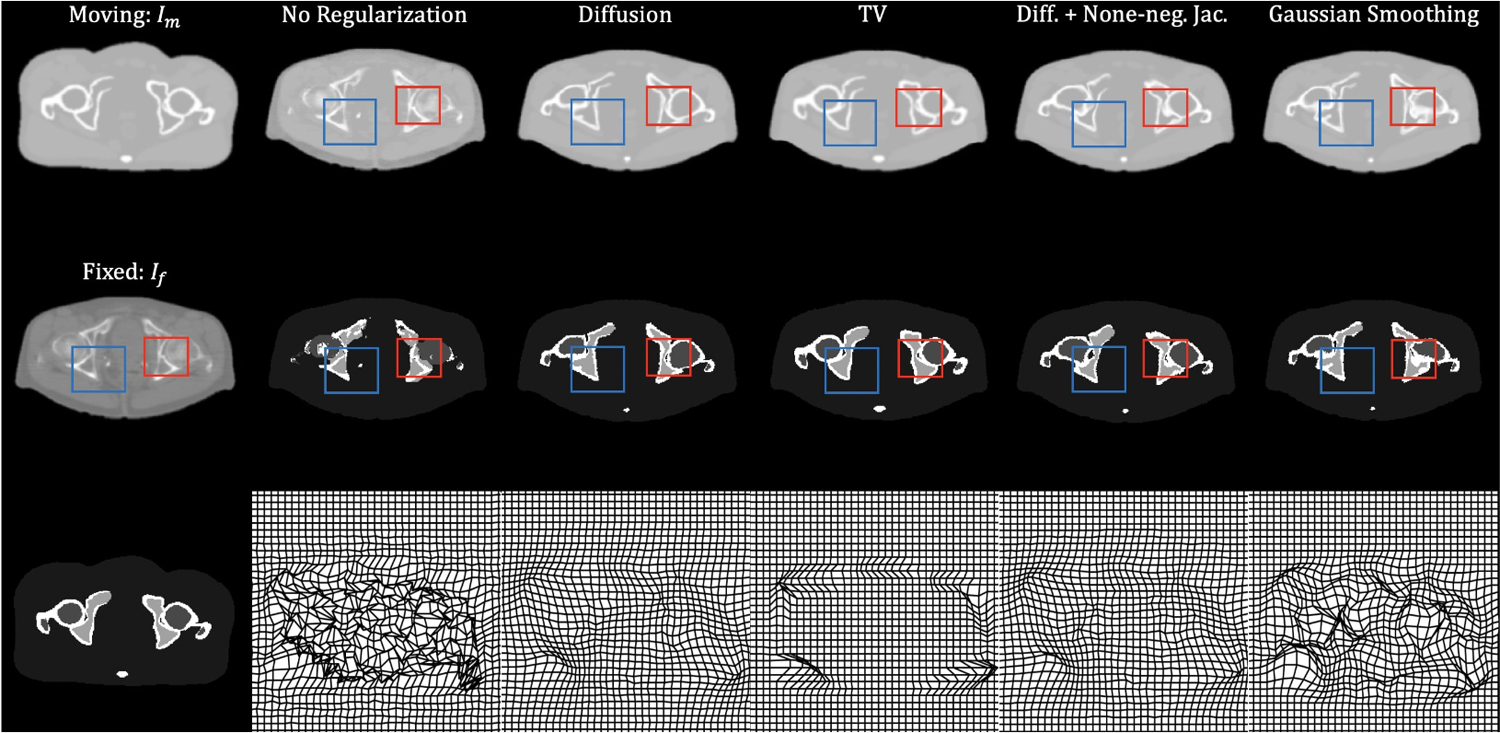
Figure 5:

Example results from different regularization techniques. The three figures in the first column represent moving image, fixed image, and the corresponding label map, respectively. The second to last column shows deformed images: the first row shows the deformed XCAT phantom, the second row shows the deformed label map, and the last row shows the deformed grid.
