Figure 2.

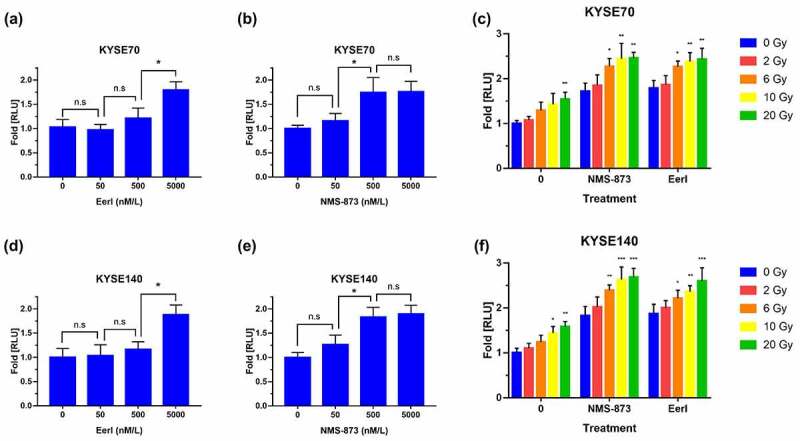
ERAD inhibitor and RT promote ATP release to extracellular space in EC cells. (a and b) Luminescence was measured after 24 hours exposure to increasing doses of EerI or NMS-873 in KYSE70 cells (0–5000 nM). (c) Luminescence was detected after 24 hours exposure to increasing doses of RT (0, 2, 6, 10, and 20 Gy) ± EerI (5000 nM) or NMS-873 (500 nM) in KYSE70 cells. (d-e) Luminescence was measured after 24 hours exposure to increasing doses of EerI or NMS-873 in KYSE140 cells (0–5000 nM). (f) Luminescence was detected after 24 hours exposure to increasing doses of RT (0, 2, 6, 10, and 20 Gy) ± EerI (5000 nM) or NMS-873 (500 nM) in KYSE140 cells. ATP: adenosine 5’-triphosphate; ERAD: endoplasmic reticulum associated protein degradation; EC: esophageal cancer; RT: radiation therapy. Data are means ± SD (N = 3), n.s, not significant, P > .05; *P ˂ 0.05; **P ˂ 0.01; ***P ˂ 0.001.
