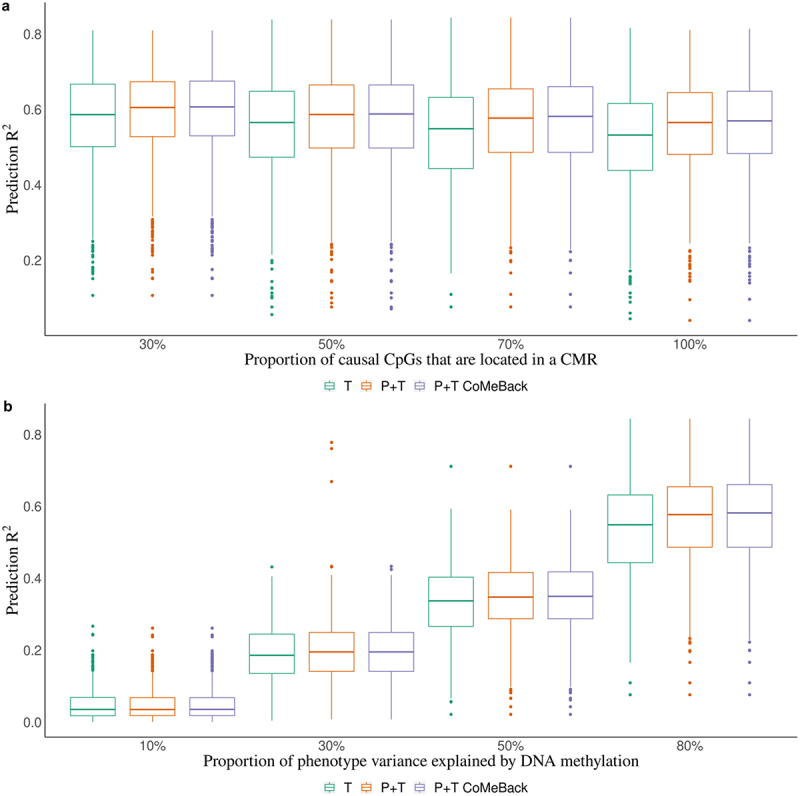
Figure 1.

Simulation study. Prediction R2 of methylation risk scores (MRS) estimated with pruning and thresholding + Co-Methylation with genomic CpG Background ((P+T CoMeBack), P+T and thresholding (T) method in dependence of (A) the proportion of causal CpG sites in co-methylation regions (CMRs) and (B) proportion of phenotype variance explained by DNA methylation, among Indian participants. For each simulation, the discovery cohort was repeatedly and randomly split into a training set comprising 762 Indians and a testing set comprising 136 people of the same ancestry. Phenotypes were simulated without an influence of ancestry. Results are shown for (a) different proportions of causal CpGs located in CMR (30%, 50%, 70%, 100%) and (b) different proportions of phenotype variance explained by DNA methylation (10%, 30%, 50%, 80%). Each box represents the distribution of prediction accuracy across 1000 simulations, where the central mark is the median and the edges of the box are the 25th and 75th percentiles.
