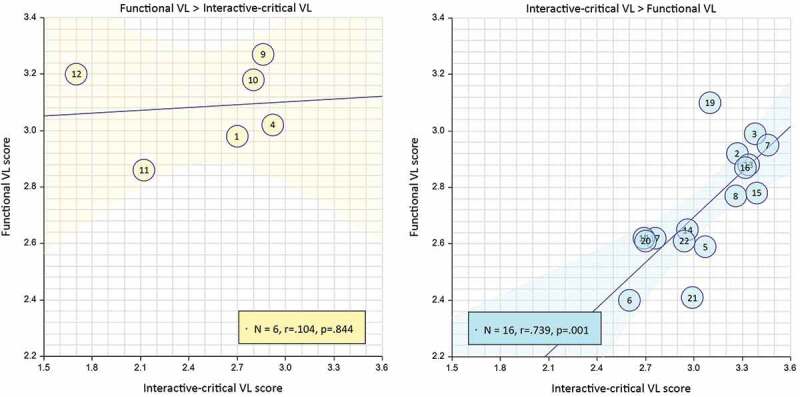
Figure 3.

Spearman’s correlation (CI 95%) between functional and interactive-critical VL (refer to Figure 2 for study numbering identification).
The left-hand graph shows studies where functional scores observed exceed interactive critical scores; the graph on the right shows those reporting a paired difference in favor of interactive-critical VL.
