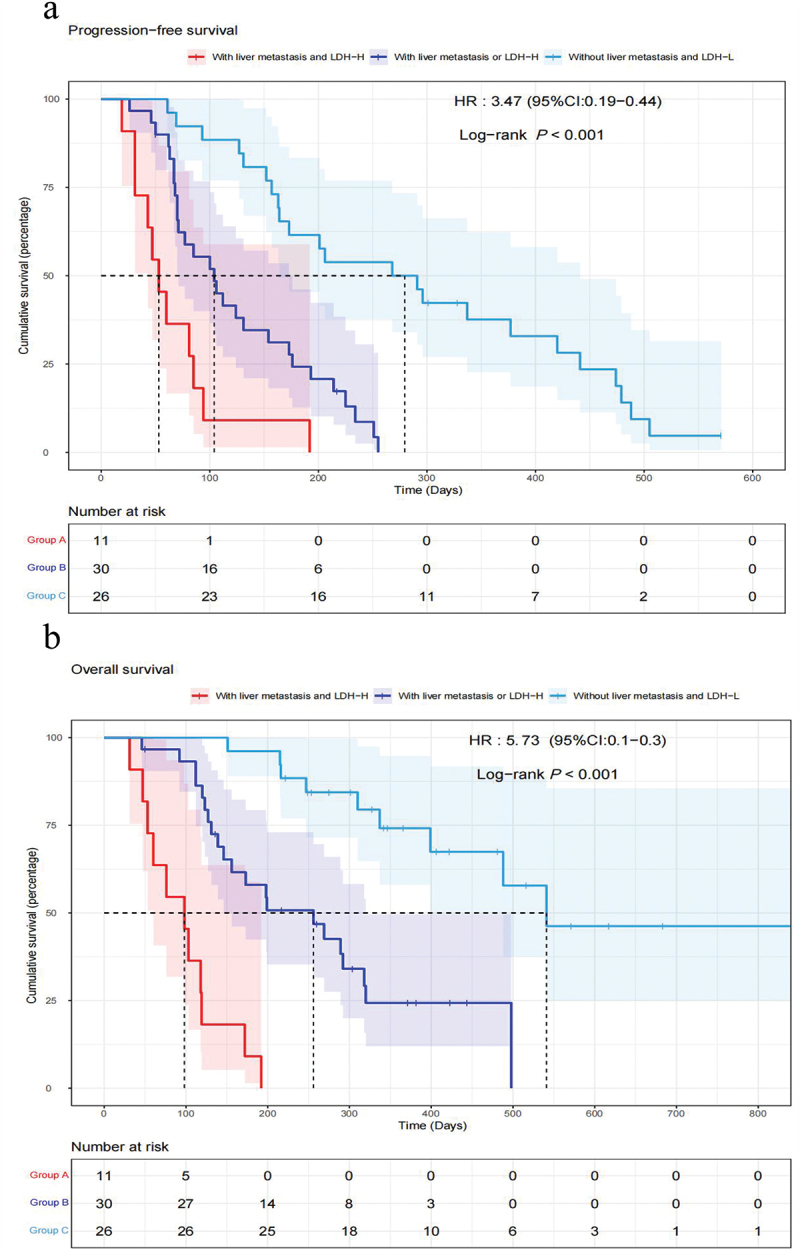
Figure 3.

Kaplan–Meier PFS curves (a) and OS curves (b) of the multifactor model according to LDH levels and liver metastasis.
Abbreviations: Group A: patients with LDH-H and liver metastasis; Group B: patients with LDH-H without liver metastasis or with liver metastasis but LDH-L; and Group C: patients with LDH-L and without liver metastasis. PFS, progression-free survival; OS, overall survival; LDH, lactate dehydrogenase; HR, hazard ratio; CI, confidence interval.
