FIGURE 2.

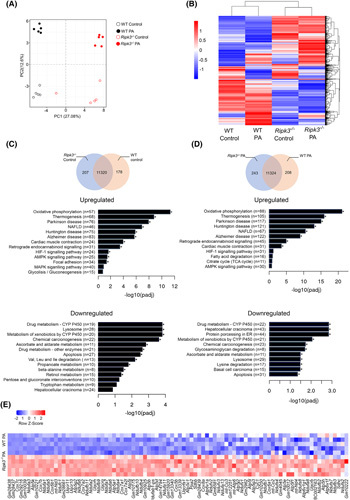
Ripk3 deficiency shifts the hepatocyte transcriptome. Wild‐type (WT) and Ripk3 −/− AML‐12 cells were treated with 125 μM palmitate (PA) for 24 h. (A) Score scatter plot corresponding to a principal component analysis (PCA) of the RNA sequencing data. Each individual is represented by one dot. (B) Heatmap of RNA‐Seq expression z scores computed for all genes that are differentially expressed between (padj ≤ 0.05, |log2FoldChange| ≥ 0), where red indicates overexpressed transcripts and blue represents underexpressed transcripts. (C) Venn diagrams showing genes expressed in unchallenged Ripk3 −/− versus WT hepatocytes. Kyoto Encyclopedia of Genes and Genomes (KEGG) pathway enrichment analysis of upregulated and downregulated differentially expressed genes (DEGs). (D) Venn diagrams showing genes expressed in PA‐treated Ripk3 −/− versus WT hepatocytes. KEGG pathway enrichment analysis of upregulated and downregulated DEGs. (E) Heatmap of z scores of DEGs associated with the KEGG pathways oxidative phosphorylation relative to the comparison Ripk3 −/− versus WT hepatocytes treated with PA. Each row in the heatmap is an individual sample. Red indicates overexpressed transcripts and blue represents underexpressed transcripts. *p < 0.05 from respective control.
