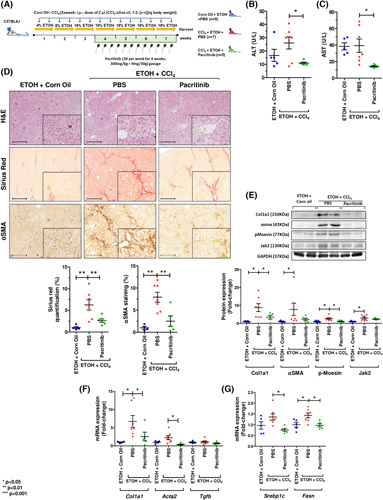
FIGURE 4.

Therapeutic approach of pacritinib in CCl4/ethanol‐induced liver fibrosis in mice. Experimental design (A), serum aminotransferases levels ALT (B) and AST (C), hematoxylin and eosin (H&E), Sirius red staining and α‐SMA immunohistochemistry representative images and quantifications (D), protein levels (E) and mRNA expression (F) of fibrotic markers. Srebp1c and Fasn gene expression (G). Results are expressed as the mean ± SEM; # p < 0.1, *p < 0.05, **p < 0.01, and ***p < 0.001. Representative photomicrographs were captured at 100× (scale bars = 200 μm) and 200× magnification (scale bars = 100 μm). α‐SMA, alpha‐smooth muscle actin; Acta2, alpha‐smooth muscle actin; ALT, alanine aminotransferase; AST, aspartate aminotransferase; CCl4, carbon tetrachloride; Col1a1, type I collagen; ETOH, ethanol; Fasn, fatty acid synthase; GAPDH, glyceraldehyde‐3‐phosphate dehydrogenase; Jak2, Janus kinase 2; p‐moesin, phospho‐moesin; Srebp1c, sterol regulatory element binding factor 1; Tgfb, transforming growth factor beta; v:v, volume:volume.
