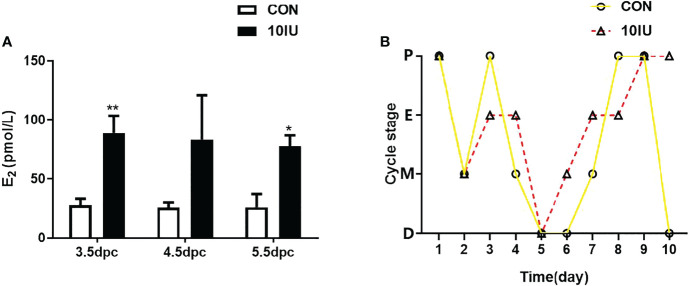
Figure 2.
Serum oestrogen level and oestrus cycle changes between the CON and 10 IU groups. (A) Serum oestrogen levels of mice in the CON and 10 IU groups during the peri-implantation period. (B) Changes in the oestrous cycle of the mice in the CON and 10 IU groups. The abscissa depicts the number of days of detection, and the ordinate depicts the oestrus cycle. P: pro-oestrus, E: oestrus, M: meta-oestrus, D: dioestrus. Compared with the control group, *p<0.05, **p<0.01.

