Figure 4.
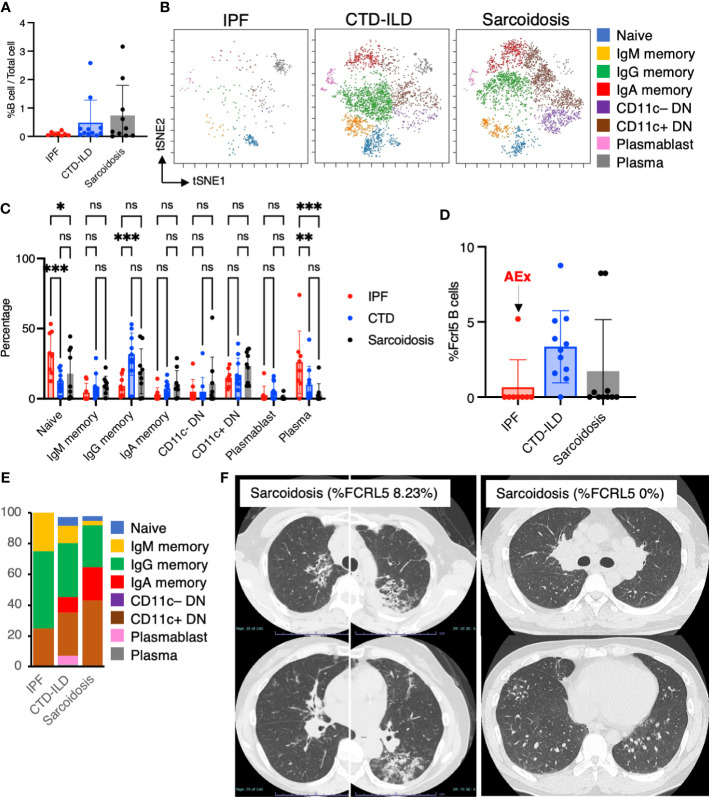
Characterization of B cell subsets in BALF from patients with IPF, CTD-ILD, and sarcoidosis. (A) Percentage of B cells and plasma cells in CD45+ BALF cells. (B) t-stochastic neighborhood embedding (t-SNE) plots of concatenated samples visualizing the distribution of B cell sub-populations in CD64–CD3– and CD19+ or CD138+ gated B cells in BALF from patients with IPF, CTD-ILD, sarcoidosis. Naive B cells are defined by CD19+IgD+, IgM memory B cells: CD19+ IgM+ CD27+, IgG memory B cells: CD19+ IgG+ CD27+, IgA memory B cells: CD19+ IgA+ CD27+, CD11c– double negative (DN) B cells: CD19+ CD11c– IgD– CD27–, CD11c+ DN B cells: CD19+ CD11c+ IgD–CD27–, plasmablasts: CD19+ CD27+ CD38+ CD138–, plasma cells: CD19– CD138+ and IgG+ or IgA+. (C) Percentage of B cell sub-populations in IPF, CTD-ILD, and sarcoidosis. Graphical plots represent individual samples. (D) Percentage of FCRL5 expressing B cells in total B cells. ns: not significant, * p < 0.05, ** p < 0.01, *** p < 0.001. (E) The proportion of each B cell subsets in FCRL5 expressing B cells. (F) Representative chest CT images of patients with sarcoidosis exhibiting a high percentage of FCRL5 B cells and a low percentage of FCRL5 B cells in BALF.

