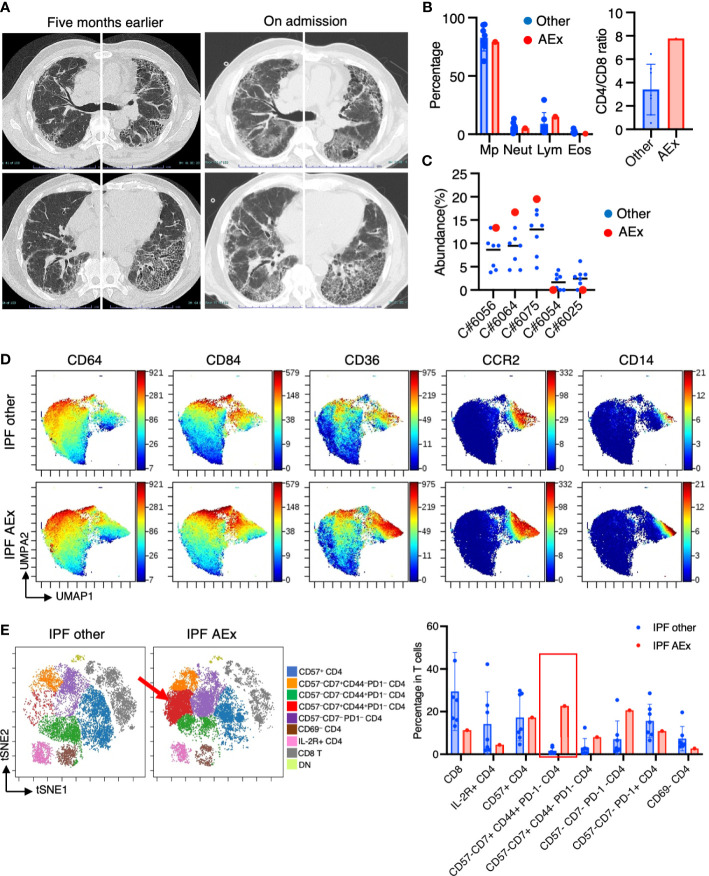
Figure 6.
Immunological phenotypes in a patient with acute exacerbation of IPF. (A) Chest computed tomography images of the patient upon admission reveal the emergence of bilateral diffuse ground glass opacities superimposed on a honeycomb pattern, accompanied by peripheral traction bronchiectasis primarily in the basal lungs. (B) Comparison of BALF cell differentiation and CD4/CD8 ratio between patients with a patient experiencing an acute exacerbation (AEx) of the condition and the other cases of IPF. (C) Citrus-generated plots for myeloid sub-populations in IPF patients with stable condition and AEx. Each cluster number (C#) corresponds to the number shown in Figure 2C . (D) A uniform manifold approximation and projection (UMAP) of myeloid cells (CD45+CD11b+CD11c+ gated) showing cell distributions and each marker expression in BALF cells from concatenated samples with AEx and other cases of IPF. (E) t-SNE plots visualizing the distribution of T cell subpopulations in BALF T cells (gated as CD45+CD2+CD3+) from patients with AEx and other cases of IPF. Double negative (DN) T cells were defined as CD4–CD8– T cells. A red arrow indicates expansion of the CD57-CD7+CD44+PD-1-CD4 T cell subpopulation in AEx-IPF.

