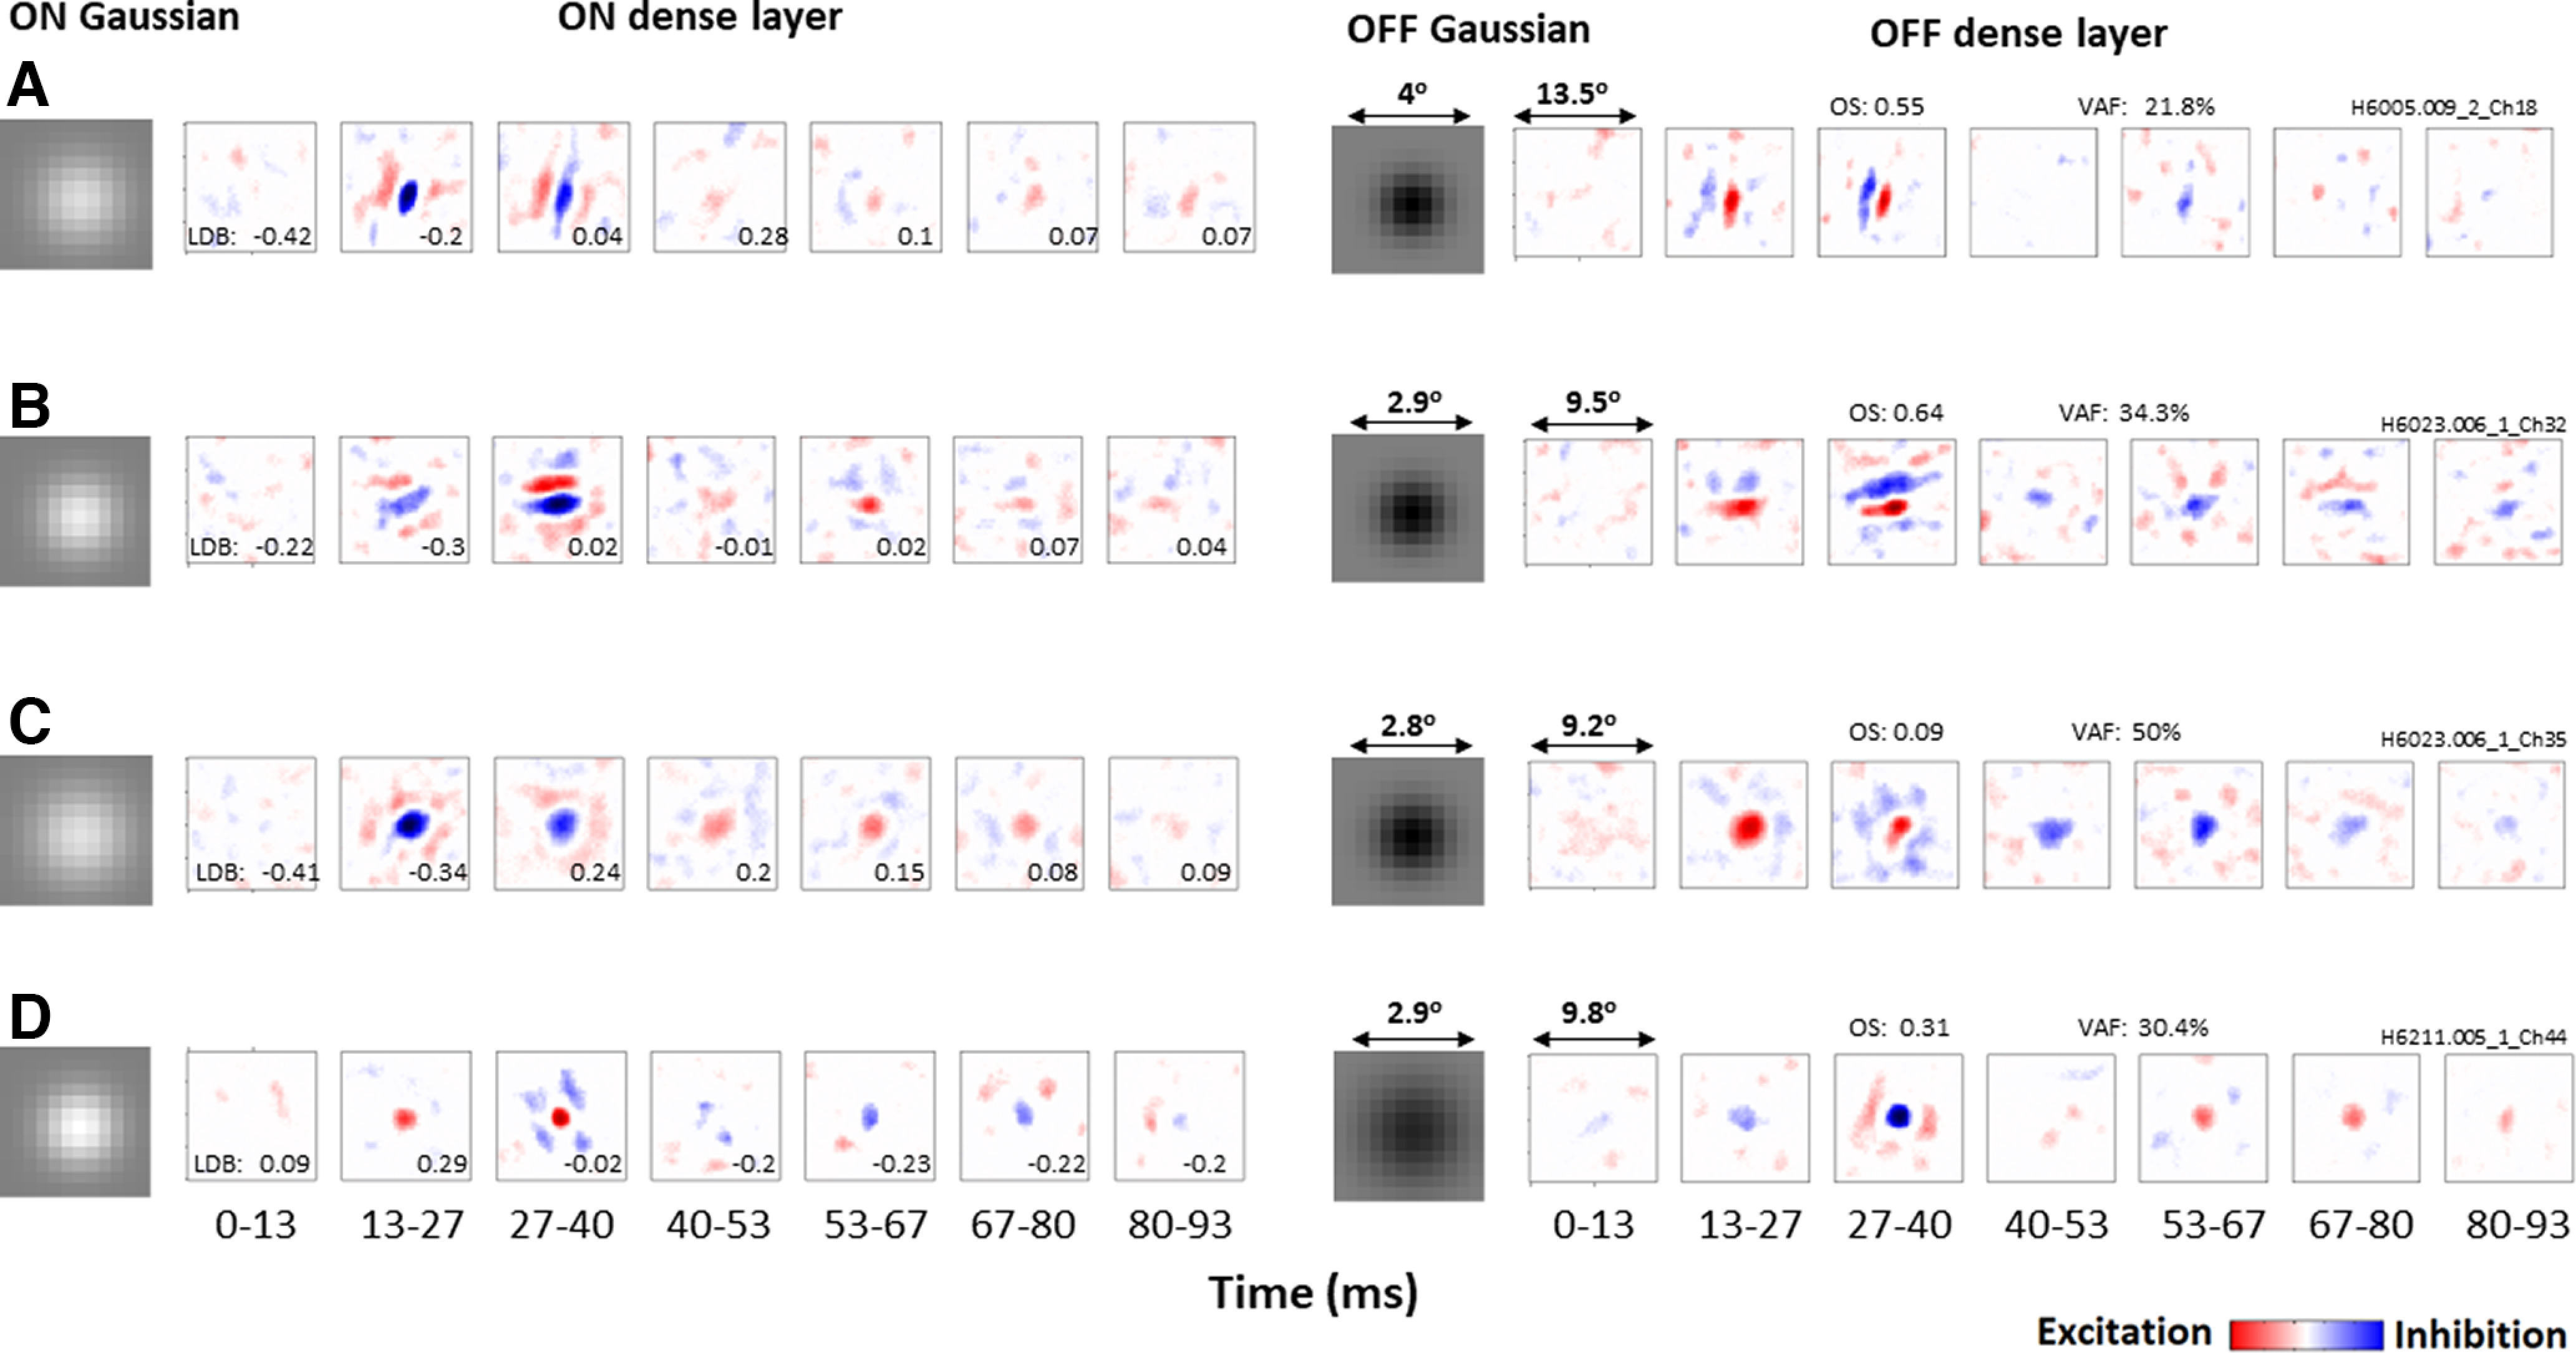
Figure 2.

Gaussian and spatiotemporal filters estimated for four example neurons, one in each row. Left, Elements of ON pathway. Right, Elements of OFF pathway. Each spatiotemporal filter is shown as a series of latencies ranging from 0–13 to 80–93 ms, with neurons being most responsive at the 13–27 and 27–40 ms latencies. Red represents positive values (excitation). Blue represents negative values (inhibition). OS and VAF are indicated for each neuron, and LDB values for each latency. A, B, Both neurons respond more strongly to dark stimuli (LDB < 0) at the 13–27 ms latency, and become more balanced (LDB ∼ 0) at the 27–40 ms latency. C, Neuron is also dark-dominant at the 13–27 ms latency but responds more strongly to light at the 27–40 ms latency. D, Neuron that is instead light-dominant at the 13–27 ms latency, and balanced at the 27–40 ms latency.
