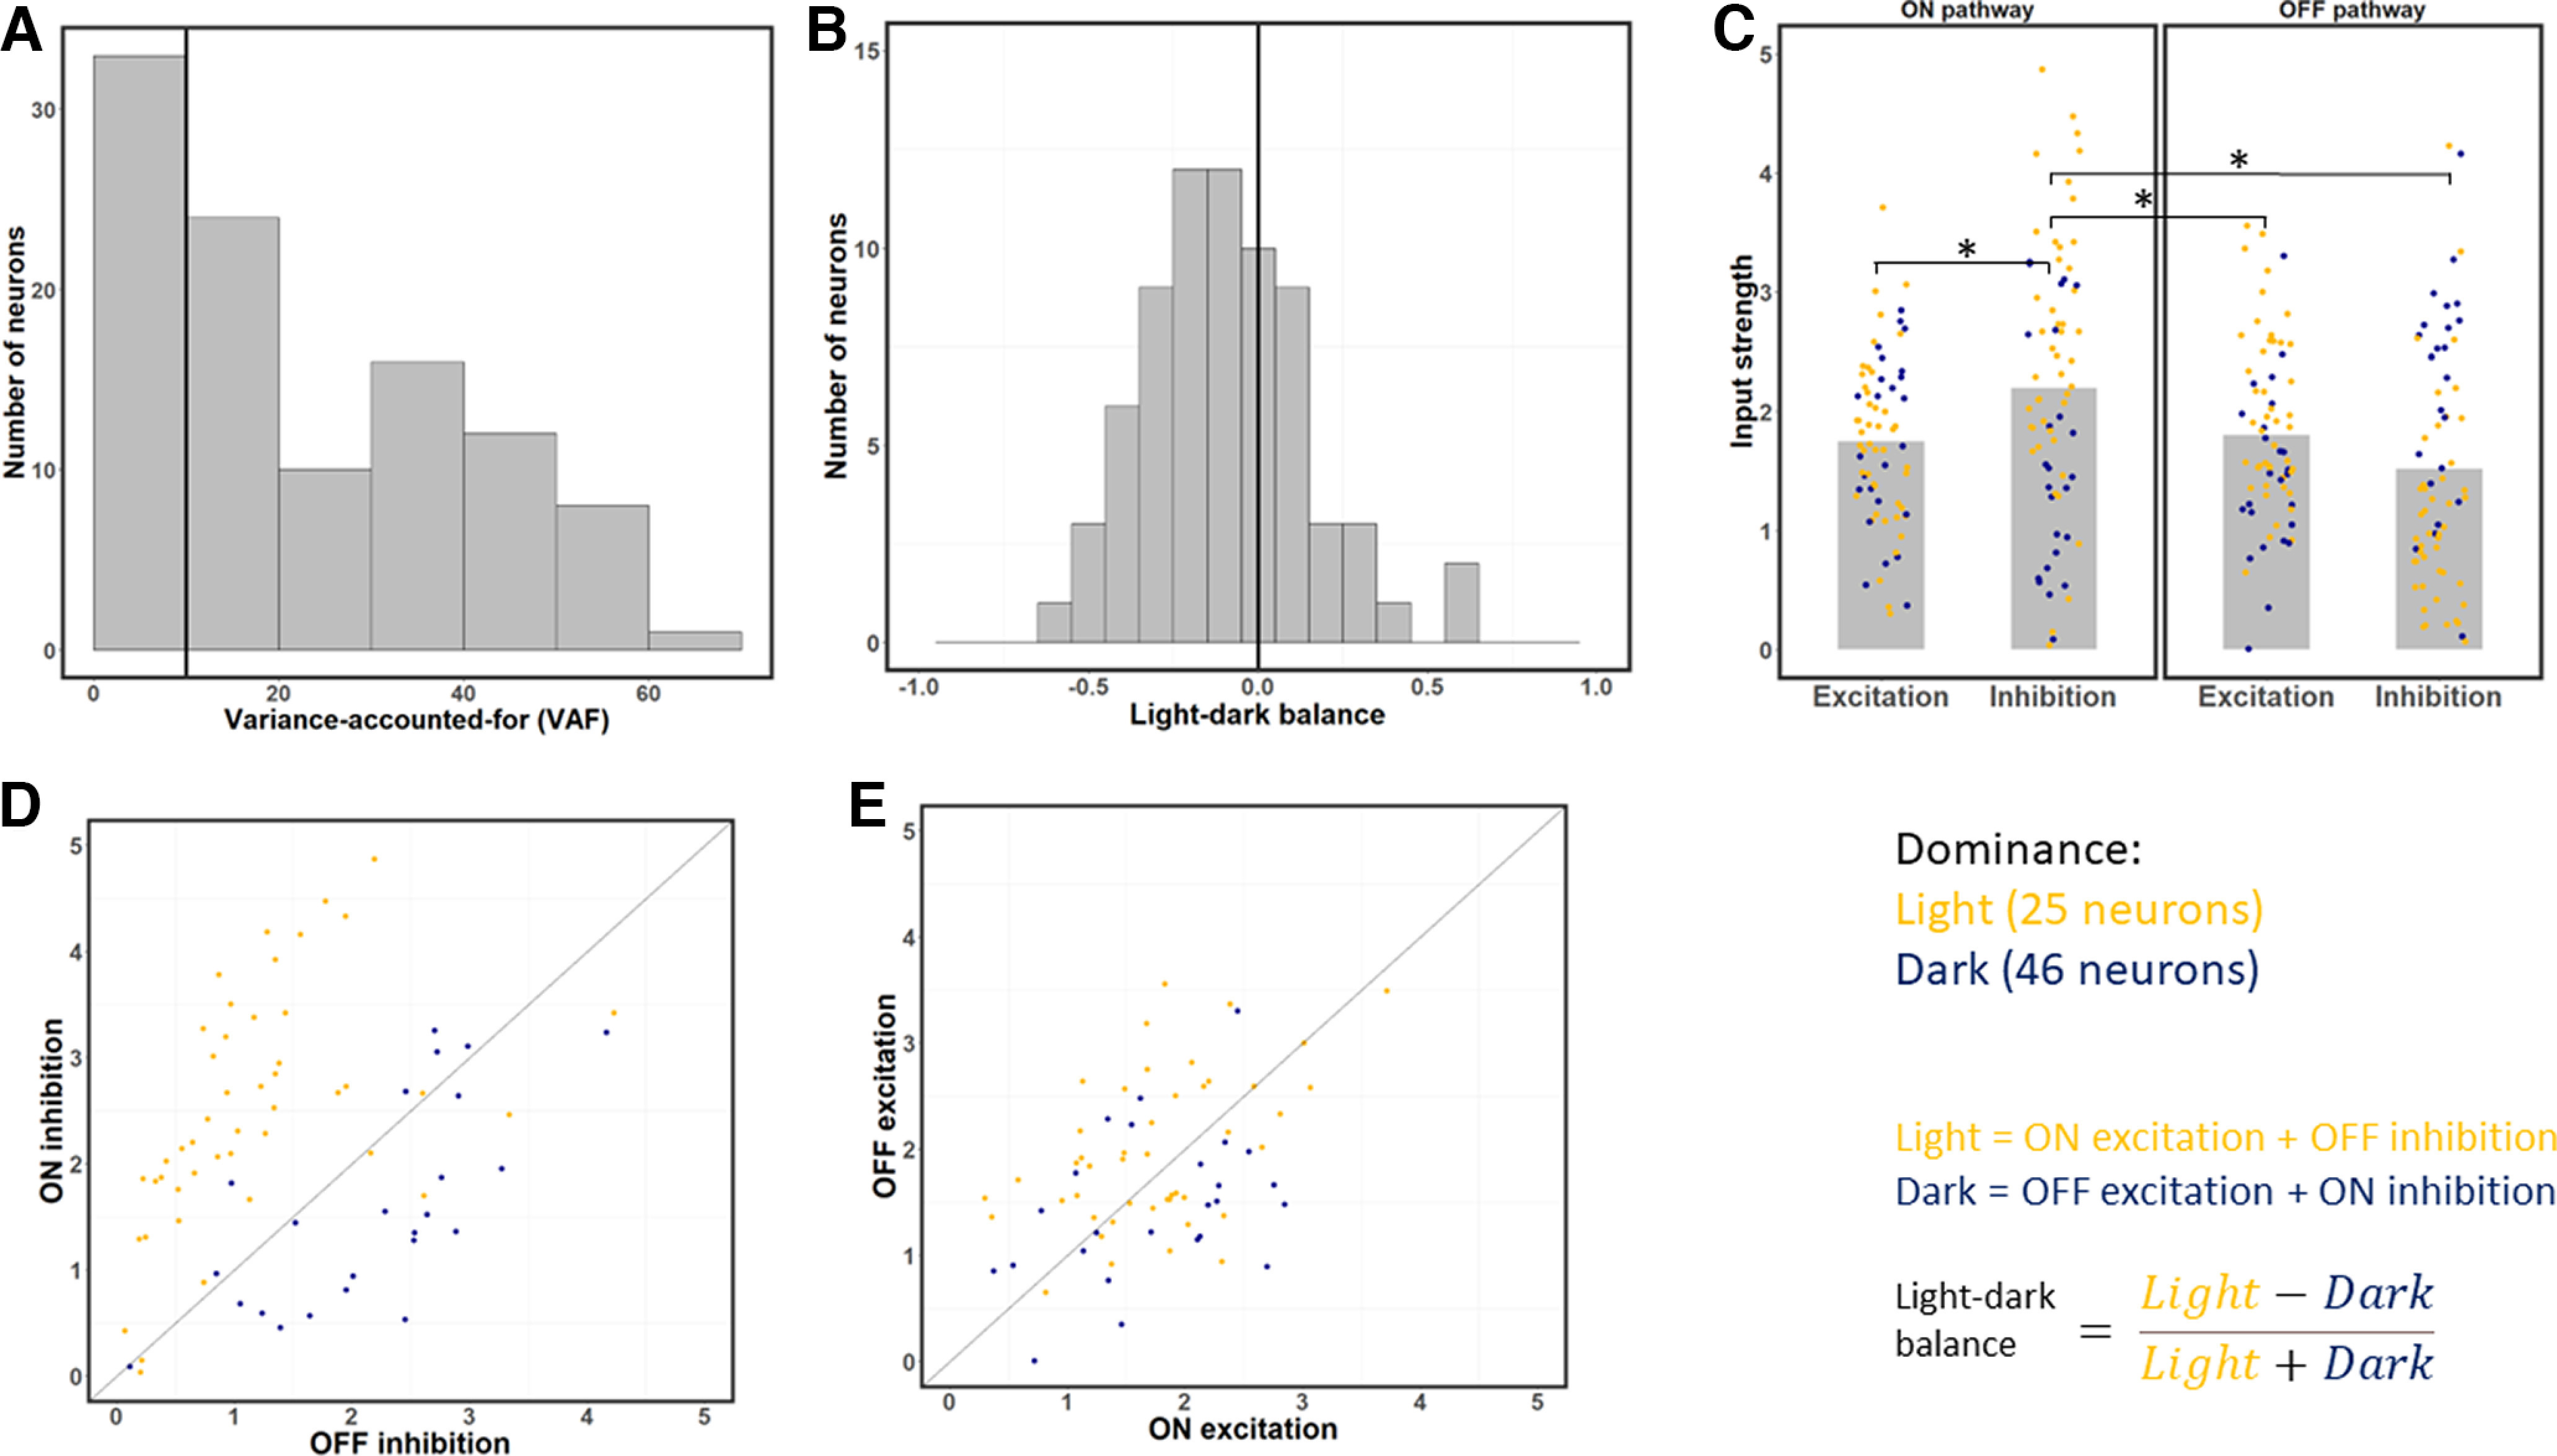
Figure 3.

Strengths of excitation and inhibition from the ON and OFF pathways at each neuron's optimal time lag. A, Distribution of VAF values across the sample. Neurons with a VAF <10% were excluded from the rest of the analysis. B, Distribution of LDB index values for each neuron at its optimal latency. This index is on average negative, which indicates neurons respond more strongly to dark than light stimuli. C, Strength of excitation and inhibition across the ON and OFF pathways for each neuron. Gray bars represent average values. ON inhibition is the strongest input on average. Yellow dots represent light-dominant neurons. Blue dots represent dark-dominant neurons. *p < 0.0083, significant paired t tests (with Bonferroni correction). D, Scatterplot of ON versus OFF inhibition, for each of the 71 neurons. Most neurons have stronger ON inhibition, and whether ON or OFF inhibition is stronger is correlated with light- and dark-dominance. E, same as in C, but for ON and OFF excitation. Unlike the result for inhibition (C), ON and OFF excitation have relatively similar strength on average.
