Figure 4.

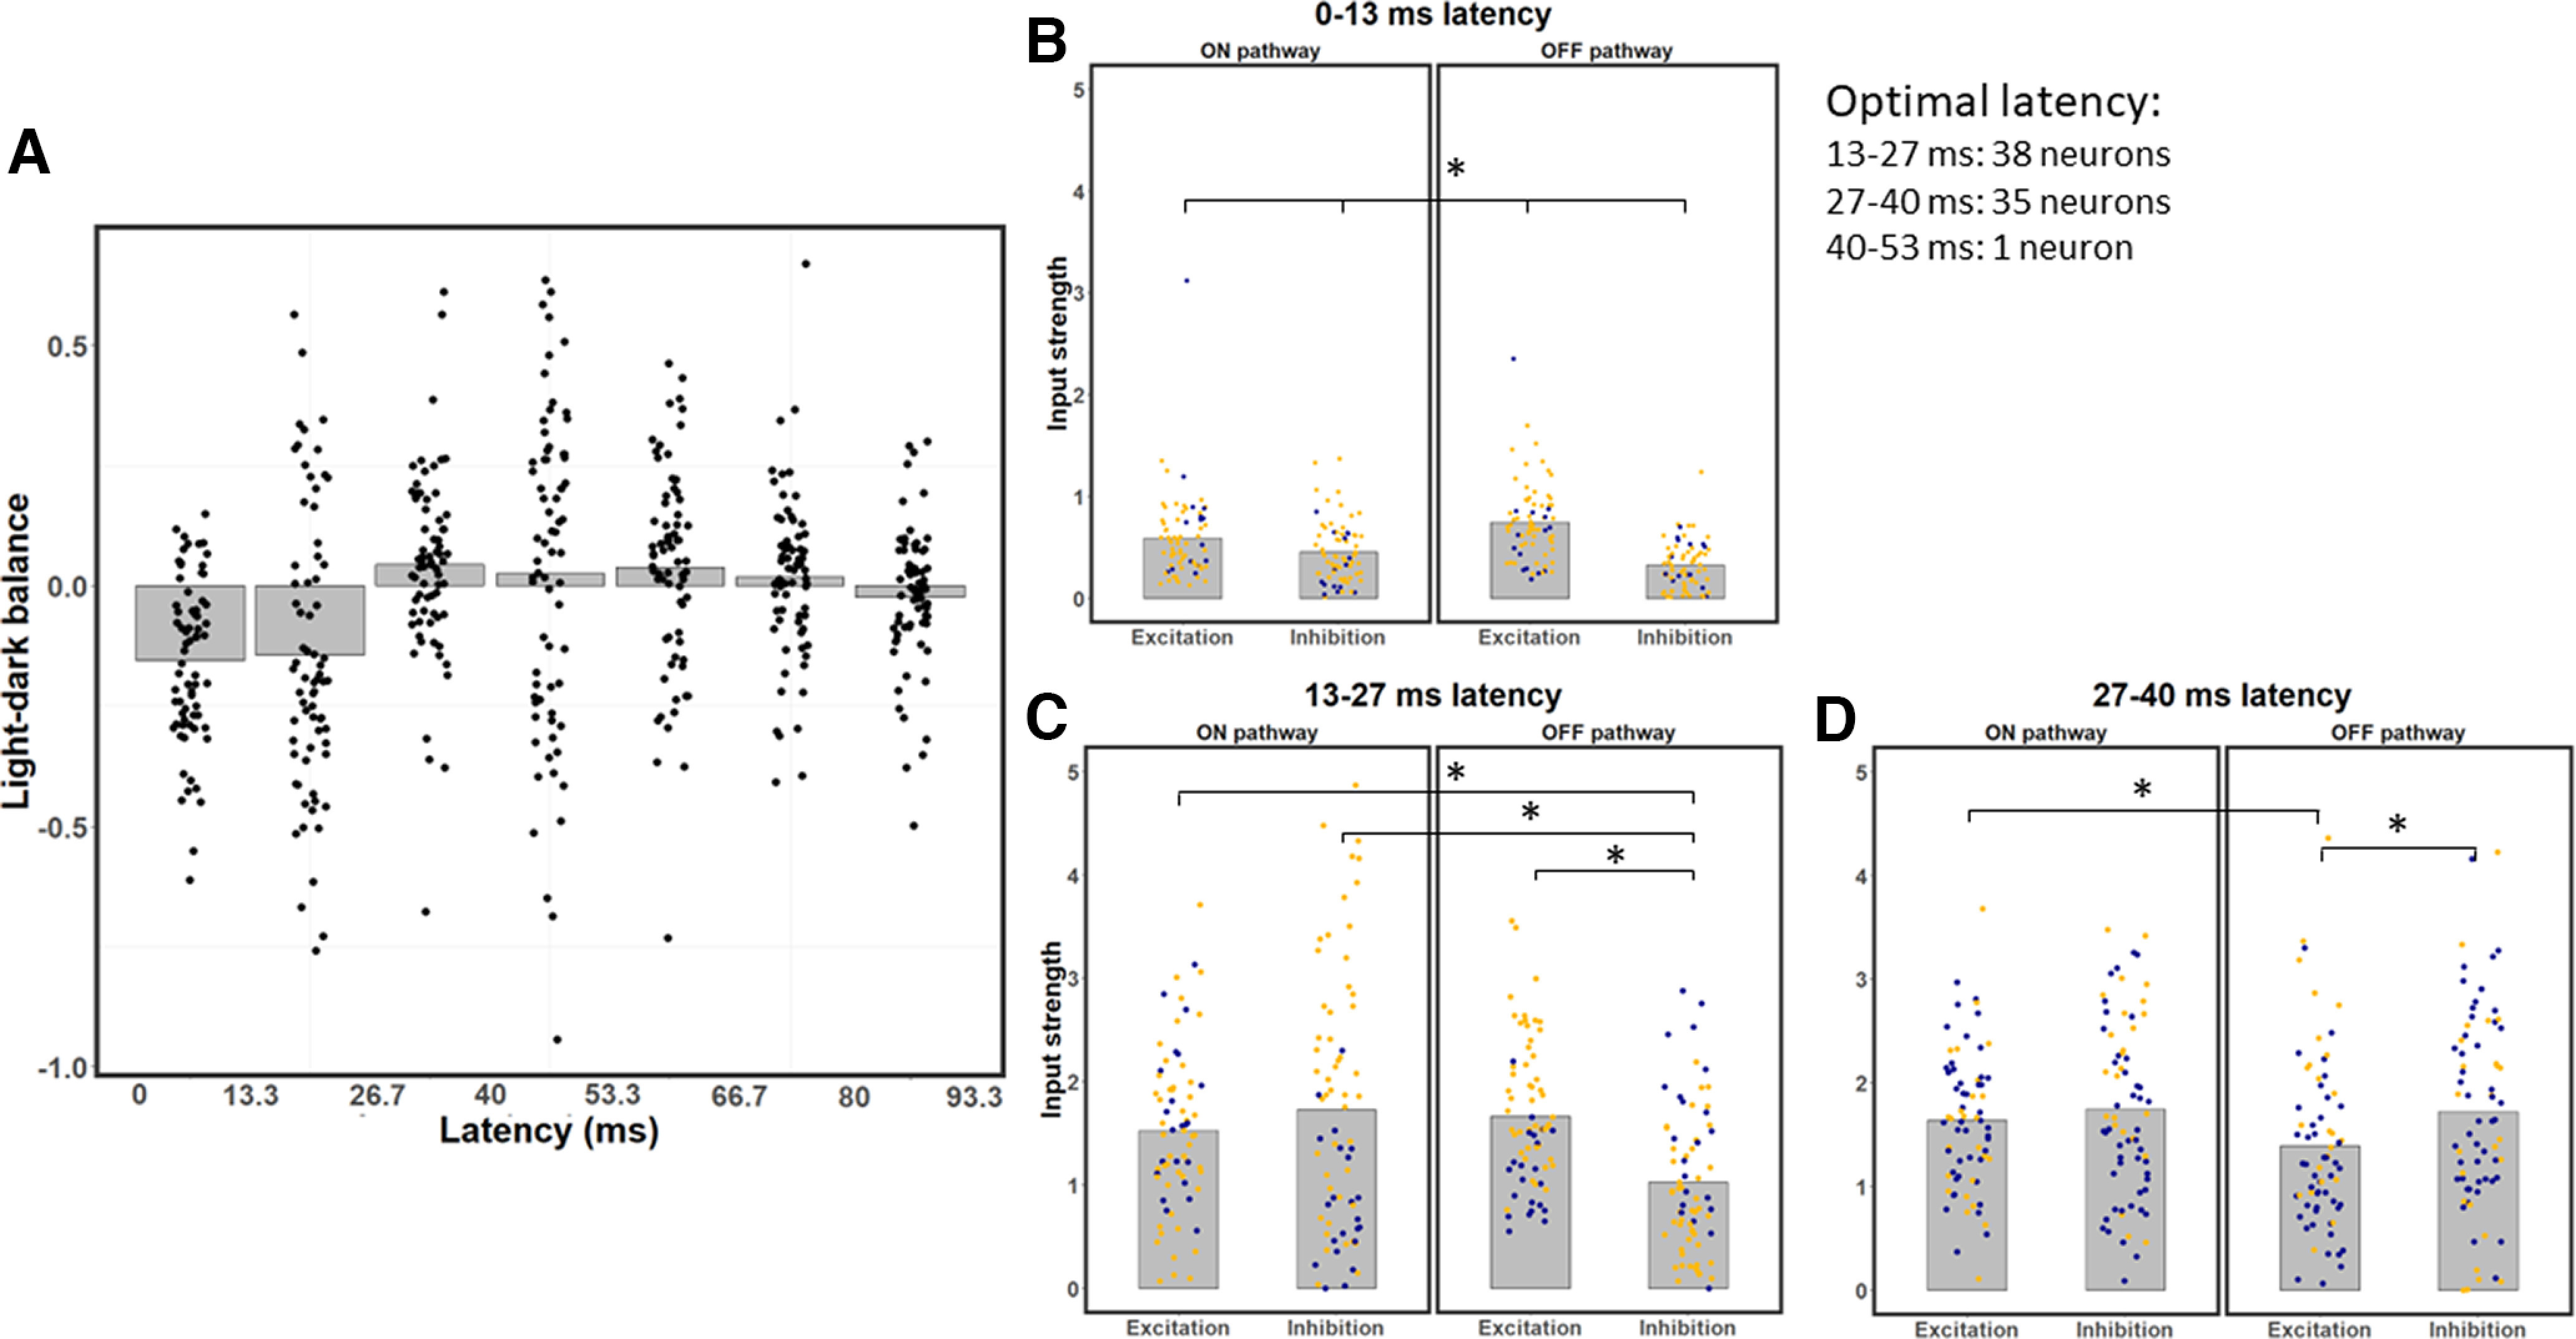
LDB index and strength of excitation/inhibition of ON and OFF pathways for all neurons, across different latencies. A, LDB index values, shown as bar graph of average values for each latency, with superimposed data points for individual neurons. The 0-13.3 and 13.3-26.7 ms latencies exhibit dark-dominance, the 26.7-40 ms latency shows a slight bias toward light-dominance and the later latencies are relatively balanced. B, Excitation and inhibition from the ON and OFF pathways for each neuron at the 0-13.3 ms latency. OFF excitation is stronger than ON excitation on average, and inhibition is significantly weaker than excitation at this latency. C, Same as in B, but for the 13.3-26.7 ms latency; note the relatively balanced values on average, except for OFF inhibition, which is significantly weaker than the other three types of input. D, Same as in B, C, but for the 26.7-40 ms latency; note the significantly weaker OFF excitation on average compared with the other three types of input. B–D, *p < 0.0083, significant paired t tests (with Bonferroni correction). All of the pairwise comparisons are significantly different in D.
