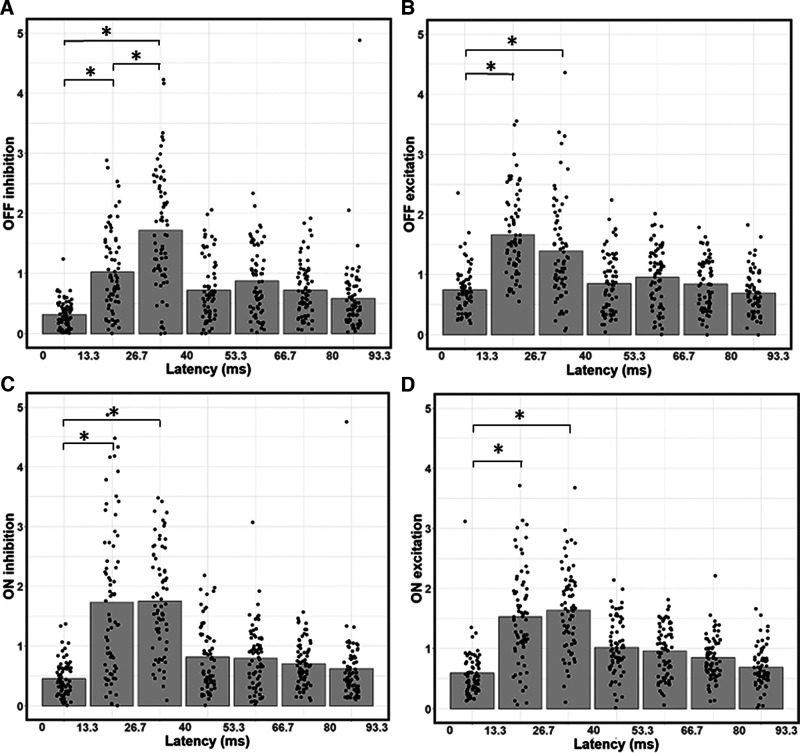
Figure 5.
Temporal dependence of contributions from ON/OFF excitation and inhibition. A, Bar graph of average OFF inhibition strength across time lags, with data points indicating values for individual neurons. OFF inhibition is weaker at the 13.3-26.7 ms latency than at the 26.7-40 ms latency. B, Same as in A, but for OFF excitation. C, Same as in A, B, but for ON inhibition. D, Same as in A–C, but for OFF excitation. *p < 0.0167, significant paired t tests between the first three latencies. OFF inhibition (A) is the only input type to significantly vary in strength between the 13.3-26.7 and 26.7-40 ms latencies. Input strength at the 0-13.3 ms latency is always significantly weaker than at the 13.3-26.7 and 26.7-40 ms latencies.

