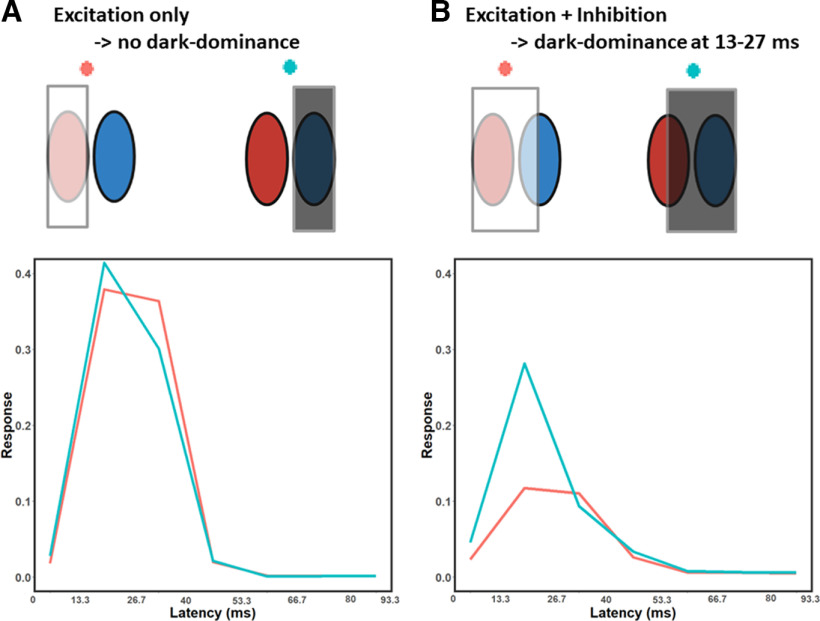
Figure 6.
Average simulated temporal impulse responses to different stimuli. The stimuli were tailored to each neuron's receptive field and are presented here in a schematic form. A, Red represents the simulated responses to light stimuli on the light-driven regions of each neuron's receptive field. Blue represents the simulated response to dark stimuli on the dark-driven regions of each receptive field. The two responses are similar, suggesting responses to light and dark stimuli are relatively balanced across latencies. B, Red represents the simulated responses to light stimuli falling on the light-driven regions, and also on half of the dark-driven regions. Blue represents the simulated responses to dark stimuli on the dark-driven regions, plus on half of the light-driven regions. As expected, the responses are weaker than in A, and this decrease is much less pronounced for the dark stimulus (blue line) at the 13–27 ms latency. These results suggest that dark-dominance predominantly occurs when measured with stimuli that recruit both the excitatory and inhibitory regions of a neuron's receptive field.

