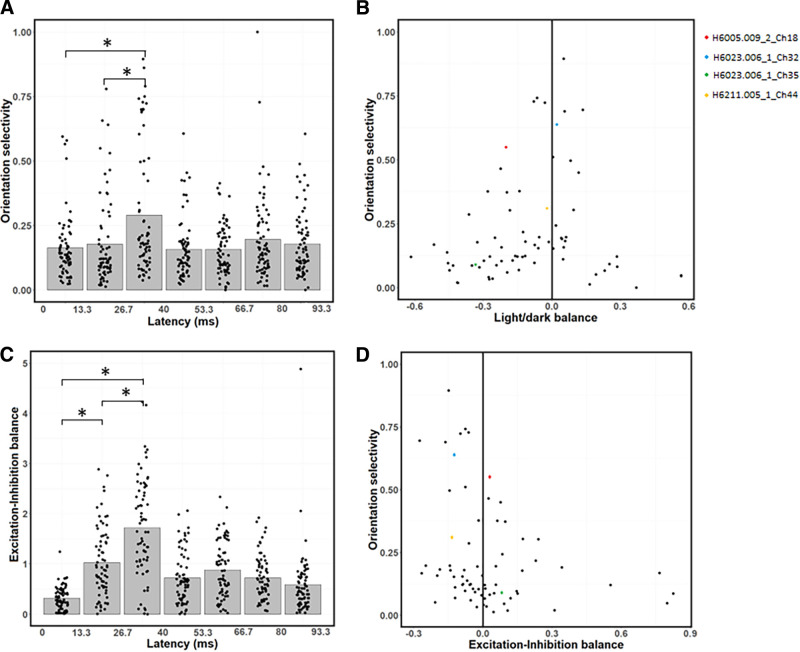
Figure 7.
Changes in OS and EIB across latencies. A, Average OS peaks at the 26.7–40 ms latency, and is relatively low at the 0–13.3 and 13.3–26.7 ms latencies. B, Relationship between OS (ordinate) and LDB (abscissa). Neurons with higher OS tend to be more balanced. C, EIB index as a function of latency. Excitation is stronger than inhibition at the 0–13.3 and 13.3–26.7 ms latencies, while excitation and inhibition are relatively balanced at the 26.7–40 ms latency. D, Relationship between OS (ordinate) and EIB (abscissa). Neurons with stronger excitation than inhibition tend to be less orientation-selective. B, D, *p < 0.0167, significant paired t tests (with Bonferroni correction) between the first three latencies (0-40 ms).

