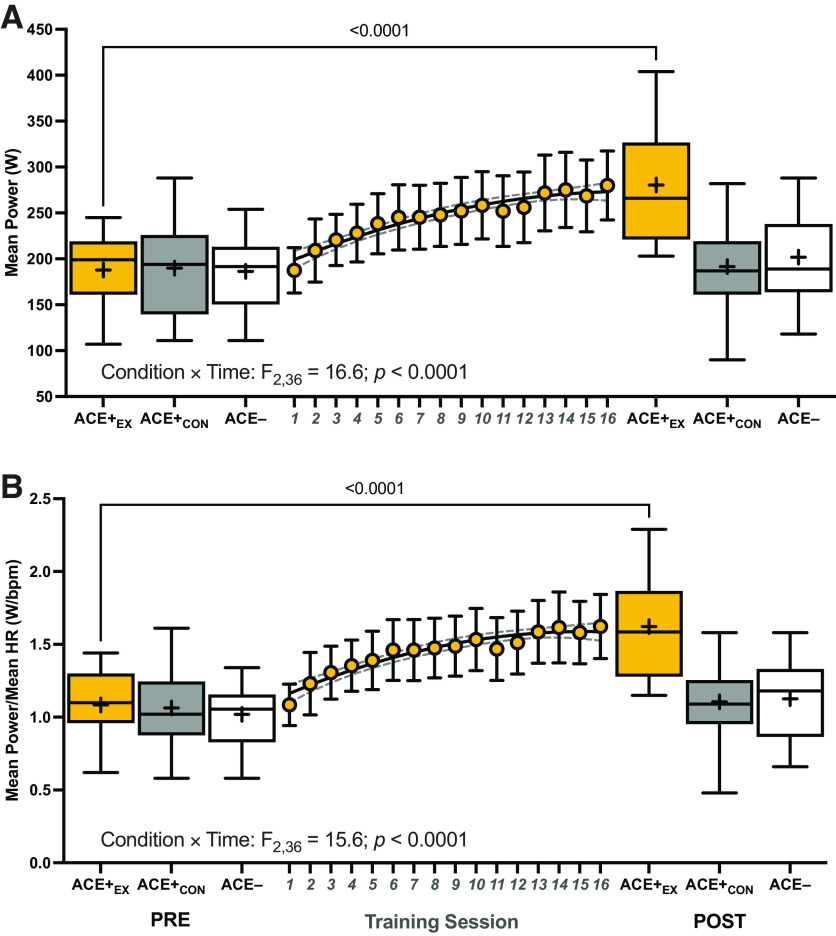
Figure 1.
The mean power (A) and mean power expressed relative to average session HR before (PRE) and after (POST) the 8-wk exercise (or control) intervention (B). Also depicted by the gold circles [±95% confidence intervals (CIs)] are the mean power and mean power relative to HR values across each of the 16 training sessions for ACE+EXT. P values from two-way mixed-effects analyses (n = 14/group; two missing values) are provided where the within-group PRE to POST change in mean power or mean power relative to HR is significant. Box and whisker plots are plotted, where the middle of the box is the median, the “+” indicates the mean, the box extends from the 25th to 75th percentiles, and the whiskers extend to the minimum and maximum observed values. ACE−, ACE− control group; ACE+CON, ACE+ control group; ACE+EX, ACE+ exercise training group; bpm, beats per minute; HR, heart rate; W, watts.

