
Figure 2.
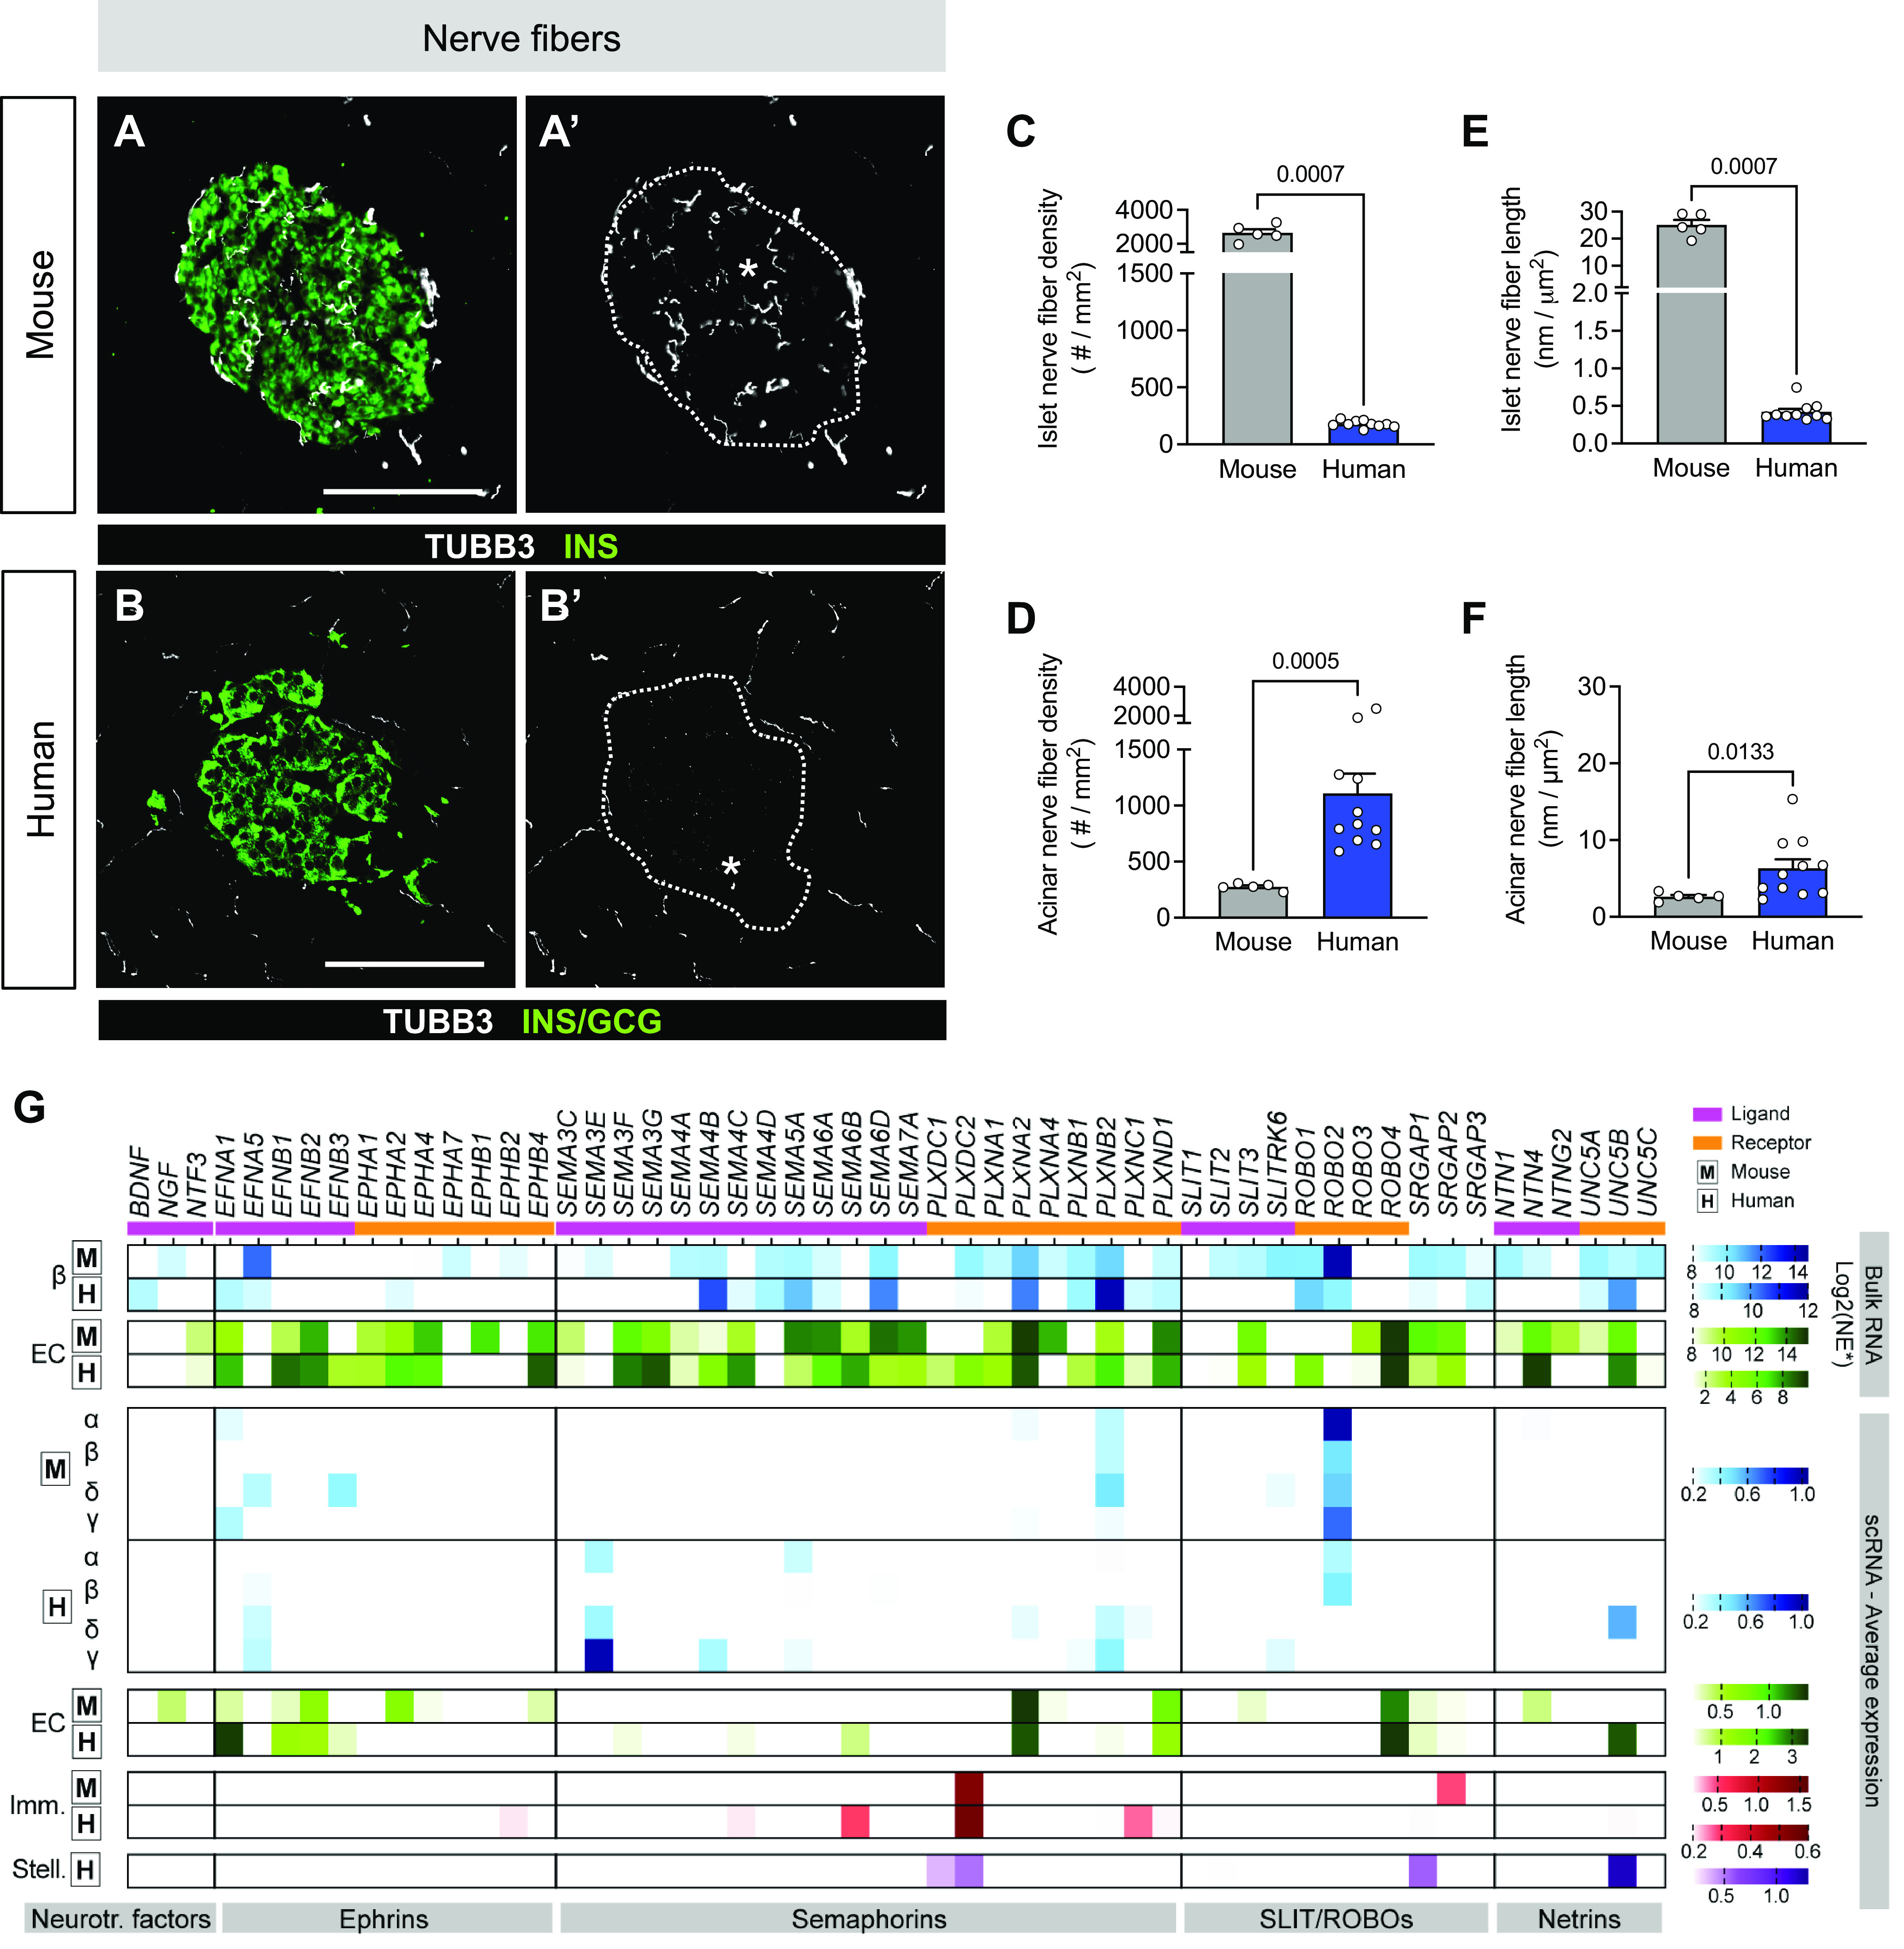
Human islets are less innervated than mouse islets. A–F: representative immunofluorescent staining (A and A′, B and B′) and quantification (C–F) of nerve fibers, as measured by tubulin beta 3 (TUBB3; white). Islets are visualized by hormones [insulin (INS), glucagon (GCG); green], and A′ and B′ show TUBB3 only with islet area outlined. Scale bars, 100 μm. Quantification (mean ± SE) includes TUBB3+ fiber density (C and D) and length in islets (E) and acinar tissue (F) from mouse (N = 5 mice; 128 total islets, 262 total acinar measurements) and human (N = 11 donors; 547 total islets, 1,830 total acinar measurements). Symbols on bar graphs represent individual mouse or human donors. Statistically significant P values (< 0.05) are stated for Mann–Whitney tests. G: transcript levels of select neuronal ligands and receptors as measured by RNA sequencing (RNA-seq). From top to bottom: mouse bulk data sets (34); human bulk beta (β) (37); human bulk endothelial (EC) (36); single-cell (sc) data sets: mouse (38) and human (39). Boxed “M” and ‘H’ label mouse and human data sets, respectively. Neurotr. factors, neurotrophic factor genes. Only values > 0.2 (sc) and log2 > 8 (bulk) are graphed. Normalized expression (NE) units vary by study; see research design and methods. Imm., immune; Stell., stellate.