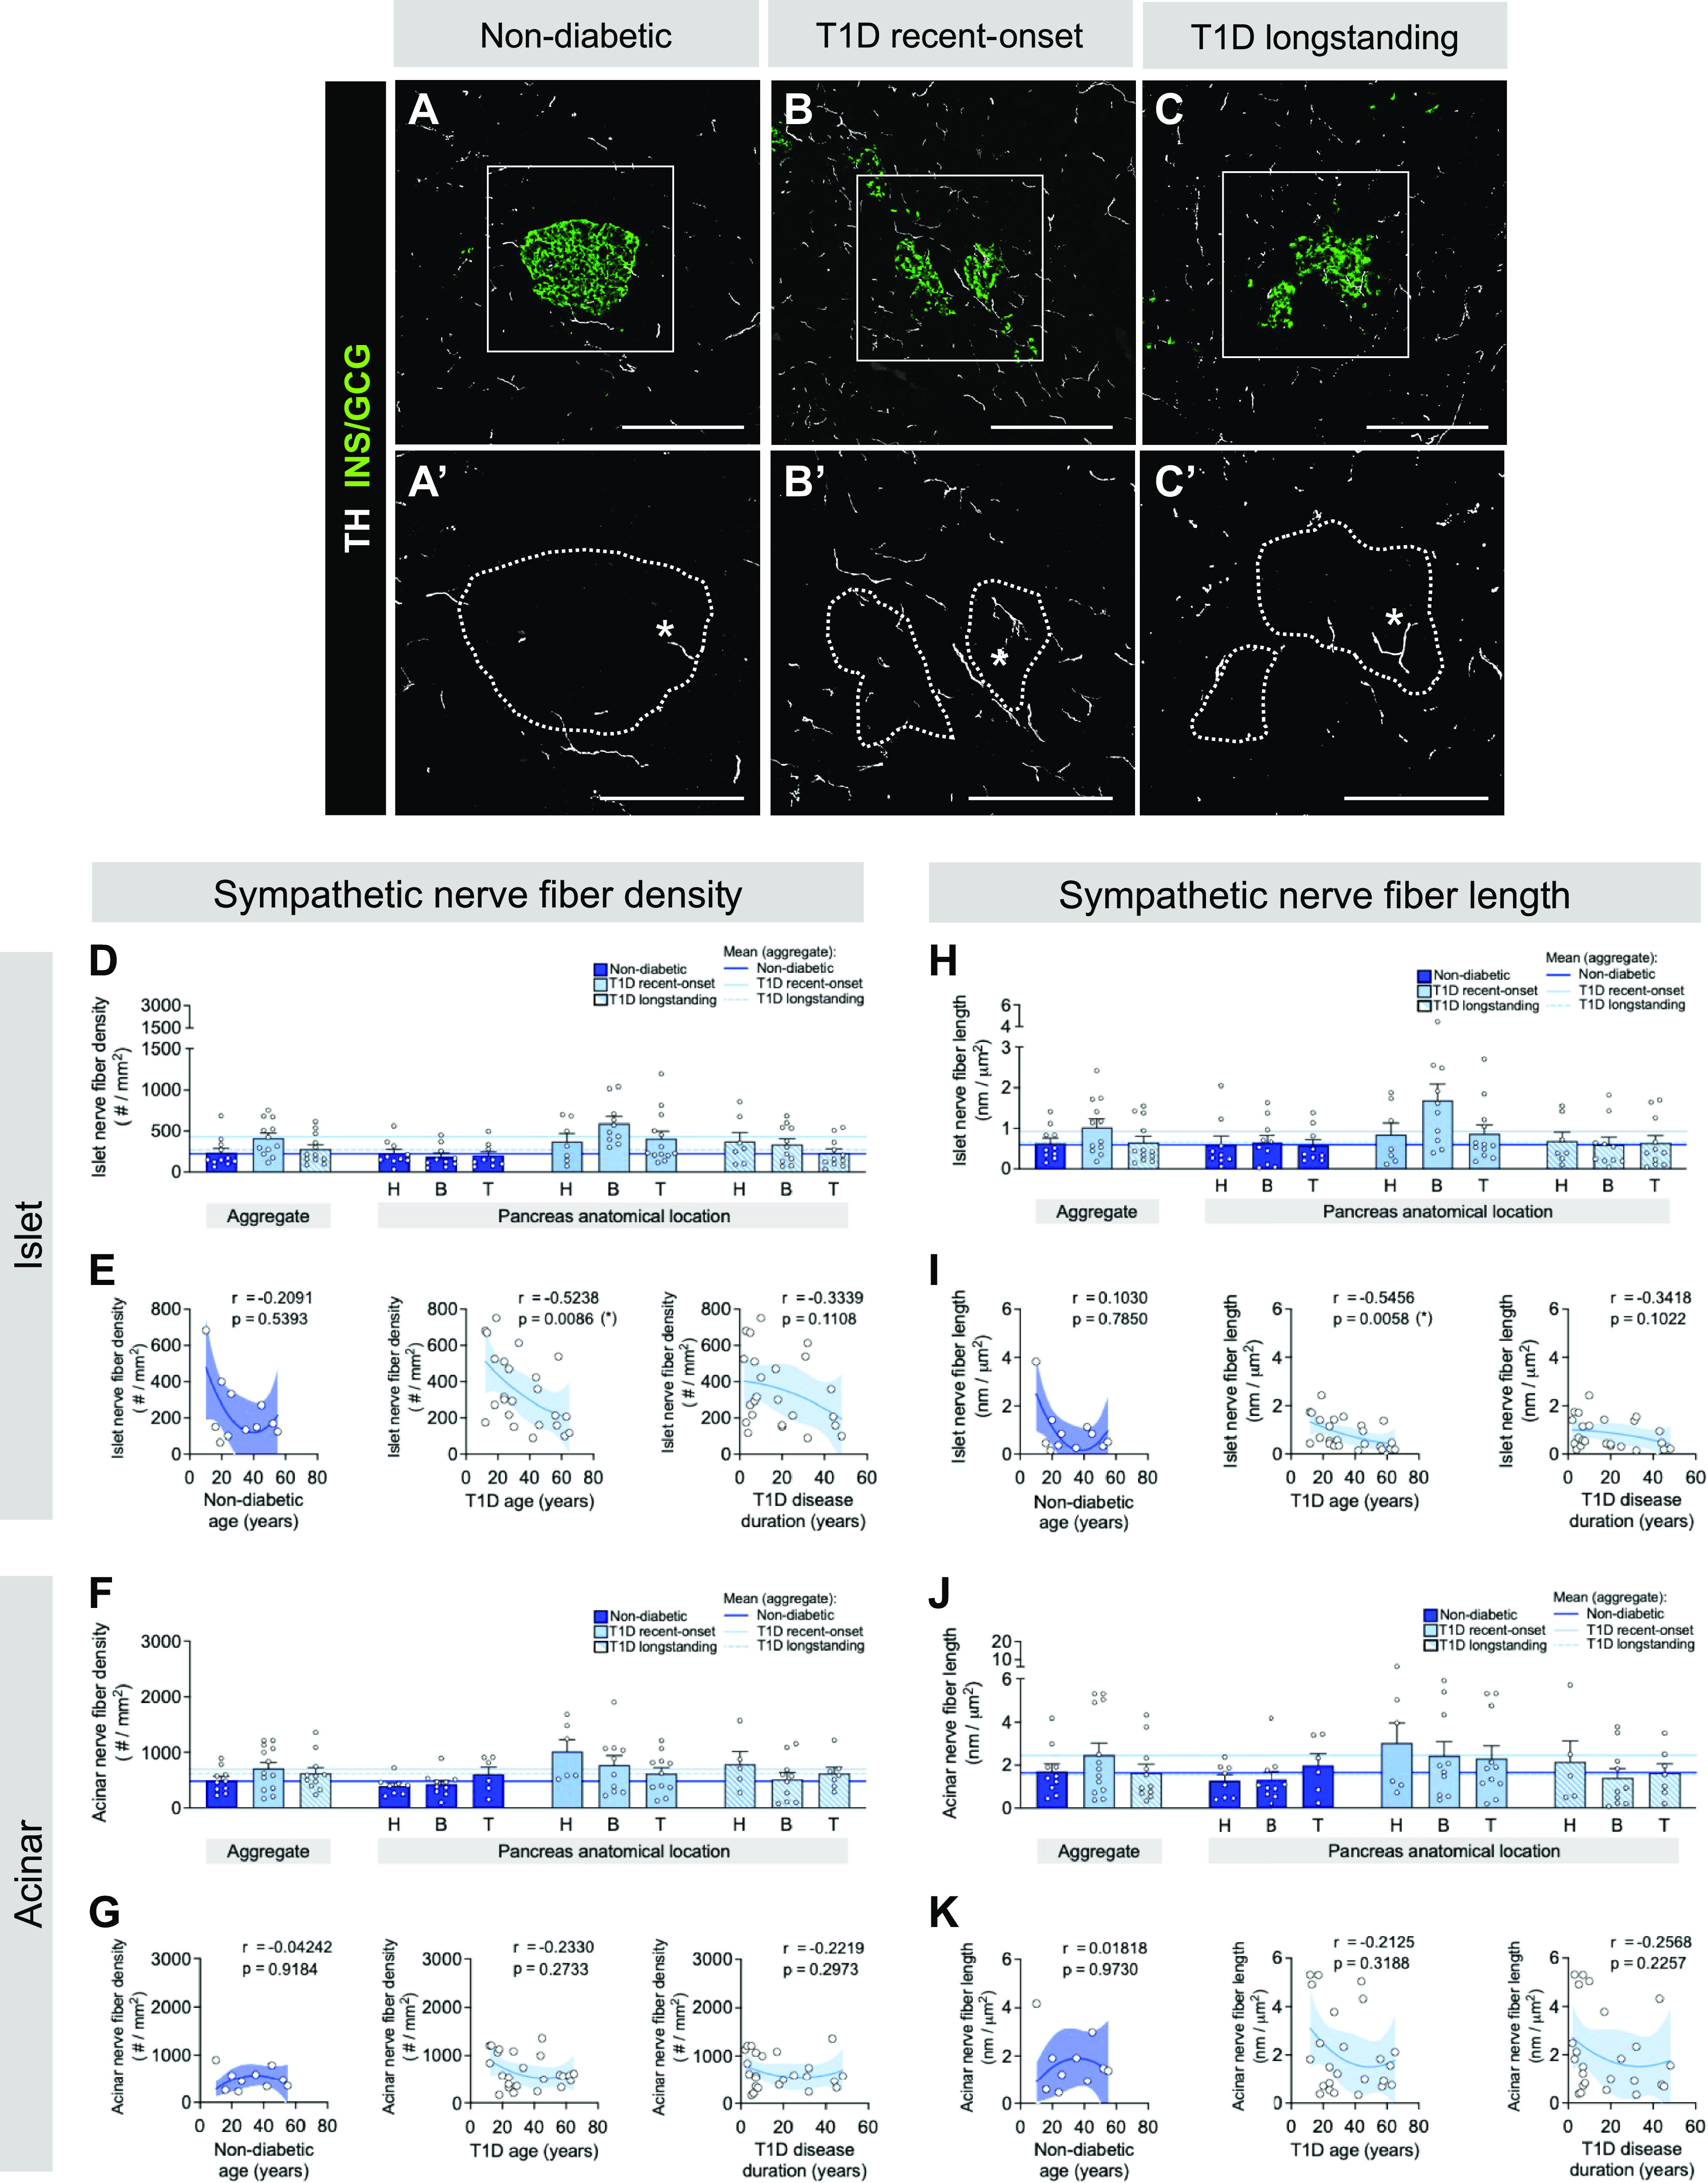
Figure 5.

Sympathetic nerve fibers are not reduced in human type 1 diabetic (T1D) compared with non-diabetic (ND) islets. A–C: representative immunofluorescent staining of sympathetic nerve fibers labeled with tyrosine hydroxylase (TH; white) in pancreatic tissue sections from ND (A), recent-onset T1D (B), and longstanding T1D (C) donors. GCG, glucagon; INS, insulin. A′–C′: insets of A–C, TH channel only, with islet area outlined. Scale bars, 100 μm. D–K: quantification (mean ± SE) of sympathetic nerve fiber density (D–G) and nerve fiber length (H–K) in islet (D, E, H, and I) and acinar (F, G, J, and K) tissue from pancreata of ND (dark blue; N = 11 donors; 514 total islets, 789 total acinar measurements), recent-onset T1D (light blue; N = 13 donors; 469 total islets, 864 total acinar measurements), and longstanding T1D (light blue striped; N = 12 donors; 325 total islets, 504 total acinar measurements) donors. Each symbol represents an individual donor; “aggregate” graph values reflect the average data from all pancreas regions, which are stratified (H, head; B, body; T, tail) on right. Horizontal lines represent mean values and are colorized based on the donor group. E and G: islet (E) and acinar (G) acinar sympathetic nerve fiber density in ND and T1D tissue, plotted as a function of donor age and disease duration. I and K: islet (I) and acinar (K) acinar sympathetic nerve fiber length in ND and T1D tissue, plotted as a function of donor age and disease duration. Statistically significant P values (<0.05) are stated for the following statistical tests: D, H, F, and J: aggregate, Kruskal–Wallis 1-way ANOVA with Dunn’s multiple comparisons tests; anatomical location, mixed-effects 1-way ANOVA with Holm–Sidak’s multiple comparison tests; E, I, G, and K: nonlinear regression analysis with lines of best fit and Spearman correlation r values denoted on each plot.
