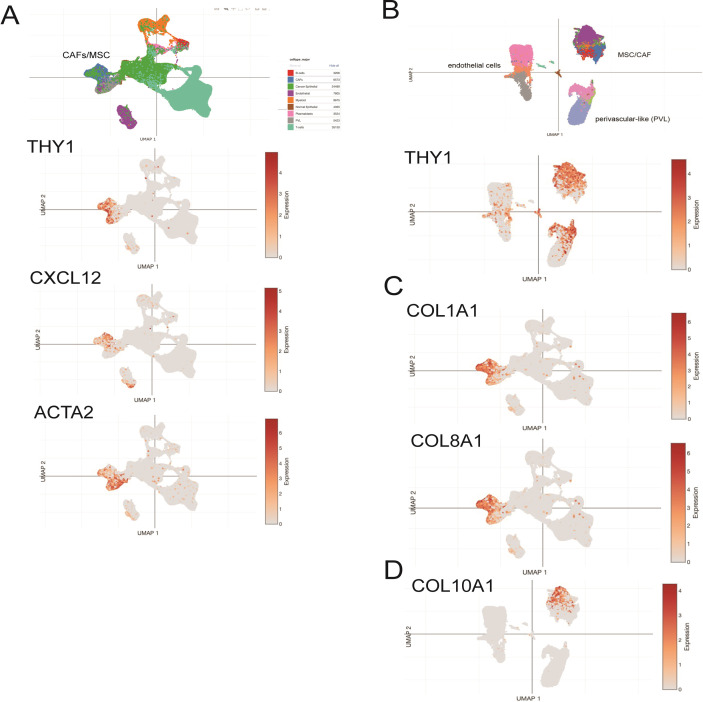
Fig 5. MSC-related gene expression can be observed in whole tumor single cell RNAseq.
UMAP visualization of 130,246 cells analyzed by scRNA-seq and integrated across 26 primary breast tumors (from Wu et al [34]). Clusters were annotated for their cell types as predicted using canonical markers for epithelial cells (EPCAM), proliferating cells (MKI67), T cells (CD3D), myeloid cells (CD68), B cells (MS4A1), plasmablasts (JCHAIN), endothelial cells (PECAM1) and mesenchymal cells (fibroblasts/perivascular-like cells; PDGFRB) and gene signature-based annotation. A) Non-tumor MSC, perivascular and endothelial cells cluster on left side of plot demonstrated the majority of THY1 (CD90), CXCL12 and ACTA2 expression in the whole tumor. B) UMAP visualization of reclustered mesenchymal cells, including CAFs (6,573 cells), PVL cells (5,423 cells), endothelial cells (7,899 cells), lymphatic endothelial cells (203 cells) and cycling PVL cells, demonstrating that the majority of CD90 (THY1) positive cells residing in the assigned MSC cluster. C) Feature plots of gene expression of COL1A1, COL8A1 in whole tumor UMAP demonstrating gene expression restricted to MSC-associated clusters, and D) MSC UMAP demonstrating COL10A1 gene expression restricted to MSC/CAFS.

