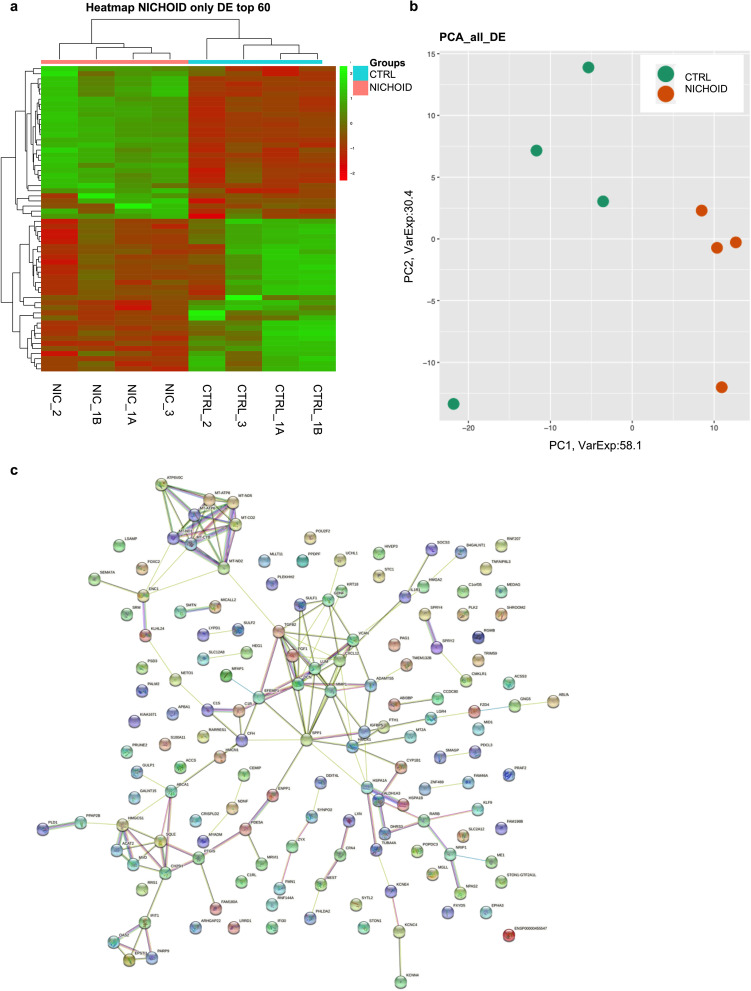
Fig. 3.
Transcriptome profile in BM-MSCs expanded inside the Nichoid vs standard conditions. a Expression profiles of differently expressed genes in Nichoid-grown BM-MSCs vs standard conditions reported as a heatmap. We considered as differentially expressed only genes showing |log2(Nichoid samples/Control samples)|≥ 1 and a False Discovery Rate ≤ 0.1; up-regulated genes are represented in green and down-regulated genes in red. b Expression profiles of significative differently expressed genes in Nichoid-grown BM-MSCs vs standard conditions reported as principal component analysis (PCA). c STRING interaction network based on significative deregulated genes where the nodes are proteins, and the edges represent the predicted functional connections. The combined score is computed by considering the probabilities from the different evidence channels corrected for the probability of randomly observing an interaction

