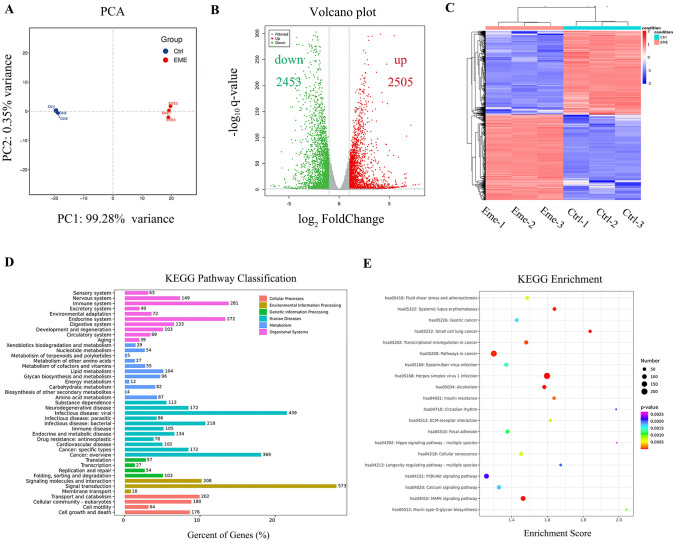
Fig. 4.
Differentially expressed genes (DEGs) and functional enrichment analysis. MGC803 cells were treated with emetine for 18 h and then used for RNA sequencing analysis. A Principal component analysis (PCA) was performed based on gene expression. B Volcano plot revealed the significantly elevated (red dots) and down-regulated (green dots) genes in emetine-treated cells. C Heatmap of DEGs between emetine and control groups. Two groups were well clustered. D KEGG pathway classification of DEGs. E KEGG enrichment analysis (Top 20) of DEGs

