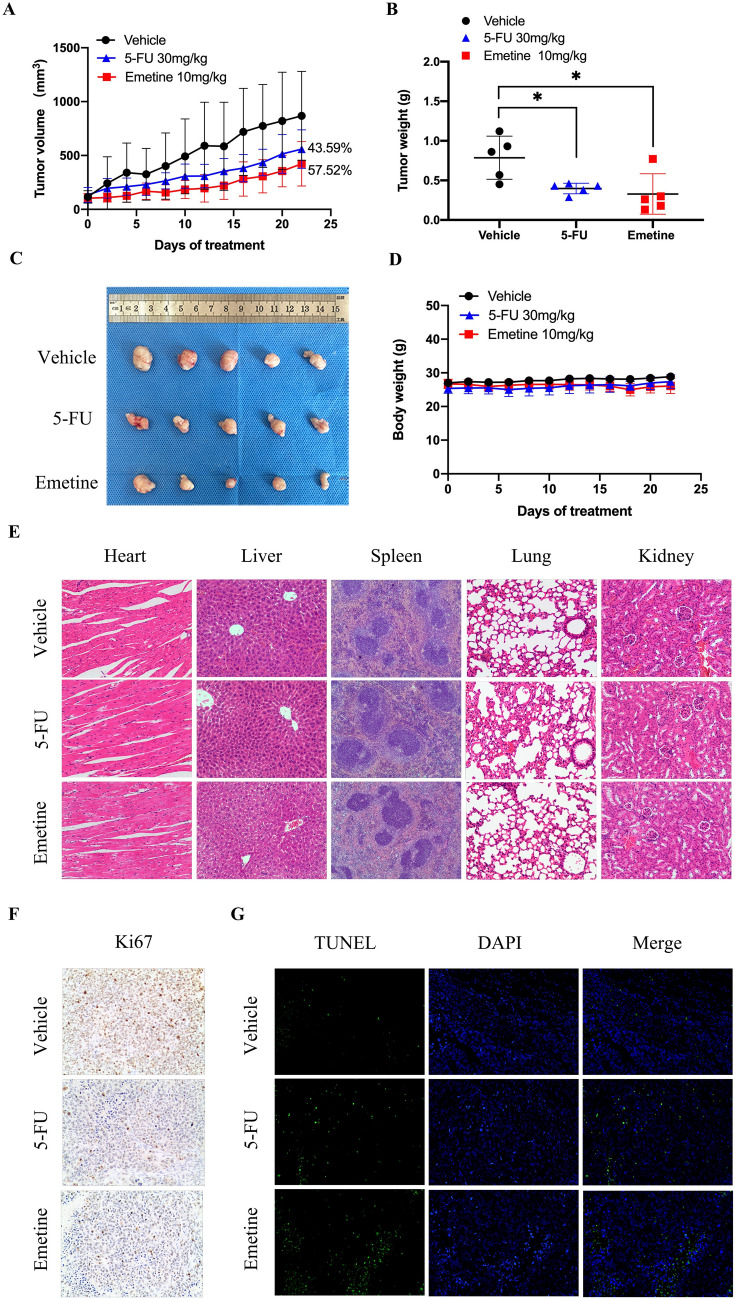
Fig. 6.
In vivo anti-GC effects of emetine in MGC803 xenograft model. A Tumor inhibition curves of emetine (10 mg/kg, qod) and 5-Fu (30 mg/kg, qod) in MGC803 xenograft model. All agents were administered intraperitoneally. Data were presented as mean tumor volume ± SD (n = 5). B Statistical chart of tumor weight in each treatment group. Data were presented as mean tumor weight ± SD (n = 5). C Tumor image obtained after the pharmacodynamic studies. D Body weights of the mice in different treatment groups. Data were presented as mean body weight ± SD (n = 5). E Representative images (100 ×) of H&E staining of the main organs collected from each treatment group. F Representative images (200 ×) of Ki67 immunohistochemical staining (brown color) conducted on the tumor sections of each treatment group. G Representative images (200 ×) of TUNEL immunofluorescence staining (green color) conducted on the tumor sections of each treatment group. *p < 0.05 vs vehicle

