
Figure 5 -.
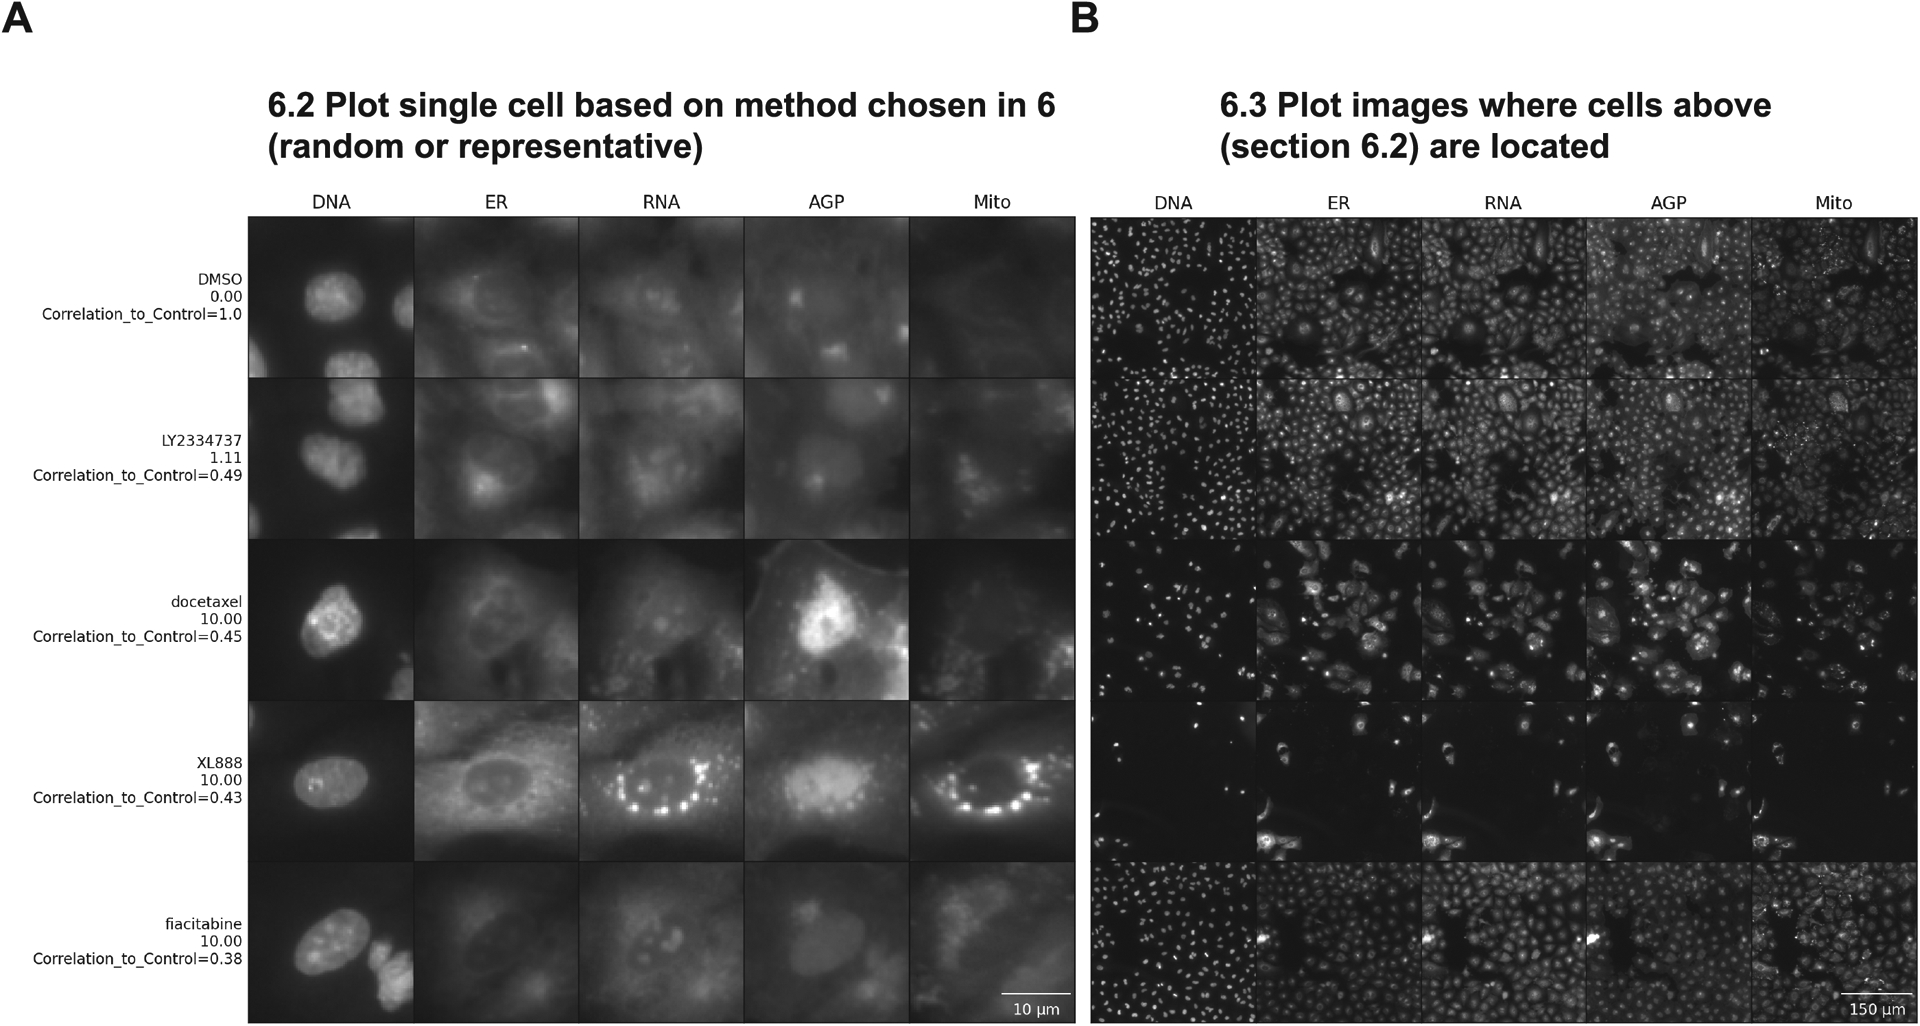
Steps to plot single cells and representative images in order of correlation values. Both images were plotted with rescaled intensity, using the representative method, 1 cell per subgroup, and ordered top to bottom by the correlation values. On the Y-axis we have the compound’s names and concentrations in μM and the X-axis above has the names of stained structures, showing the different fluorescence channels available in this experiment: DNA (nucleus stained with Hoechst 33342, excitation/emission 405/450 nm), ER (endoplasmic reticulum stained with Concanavalin A, excitation/emission 488/525 nm), RNA (nucleoli and cytoplasmic RNA stained with SYTO 14, excitation/emission 488/600 nm), AGP (actin stained with phalloidin, Golgi and plasma membrane stained with wheat germ agglutinin, both acquired with excitation/emission 561/600 nm), and Mito (mitochondria stained with MitoTracker Deep Red, excitation/emission 640/750 nm). For complete details about the Cell Painting procedure, see more at (Bray et al., 2016). (A) Shows a single representative cell for each group in this dataset. Scale bar = 10 μm (B) shows the field of view where each representative cell is located. Scale bar = 150 μm