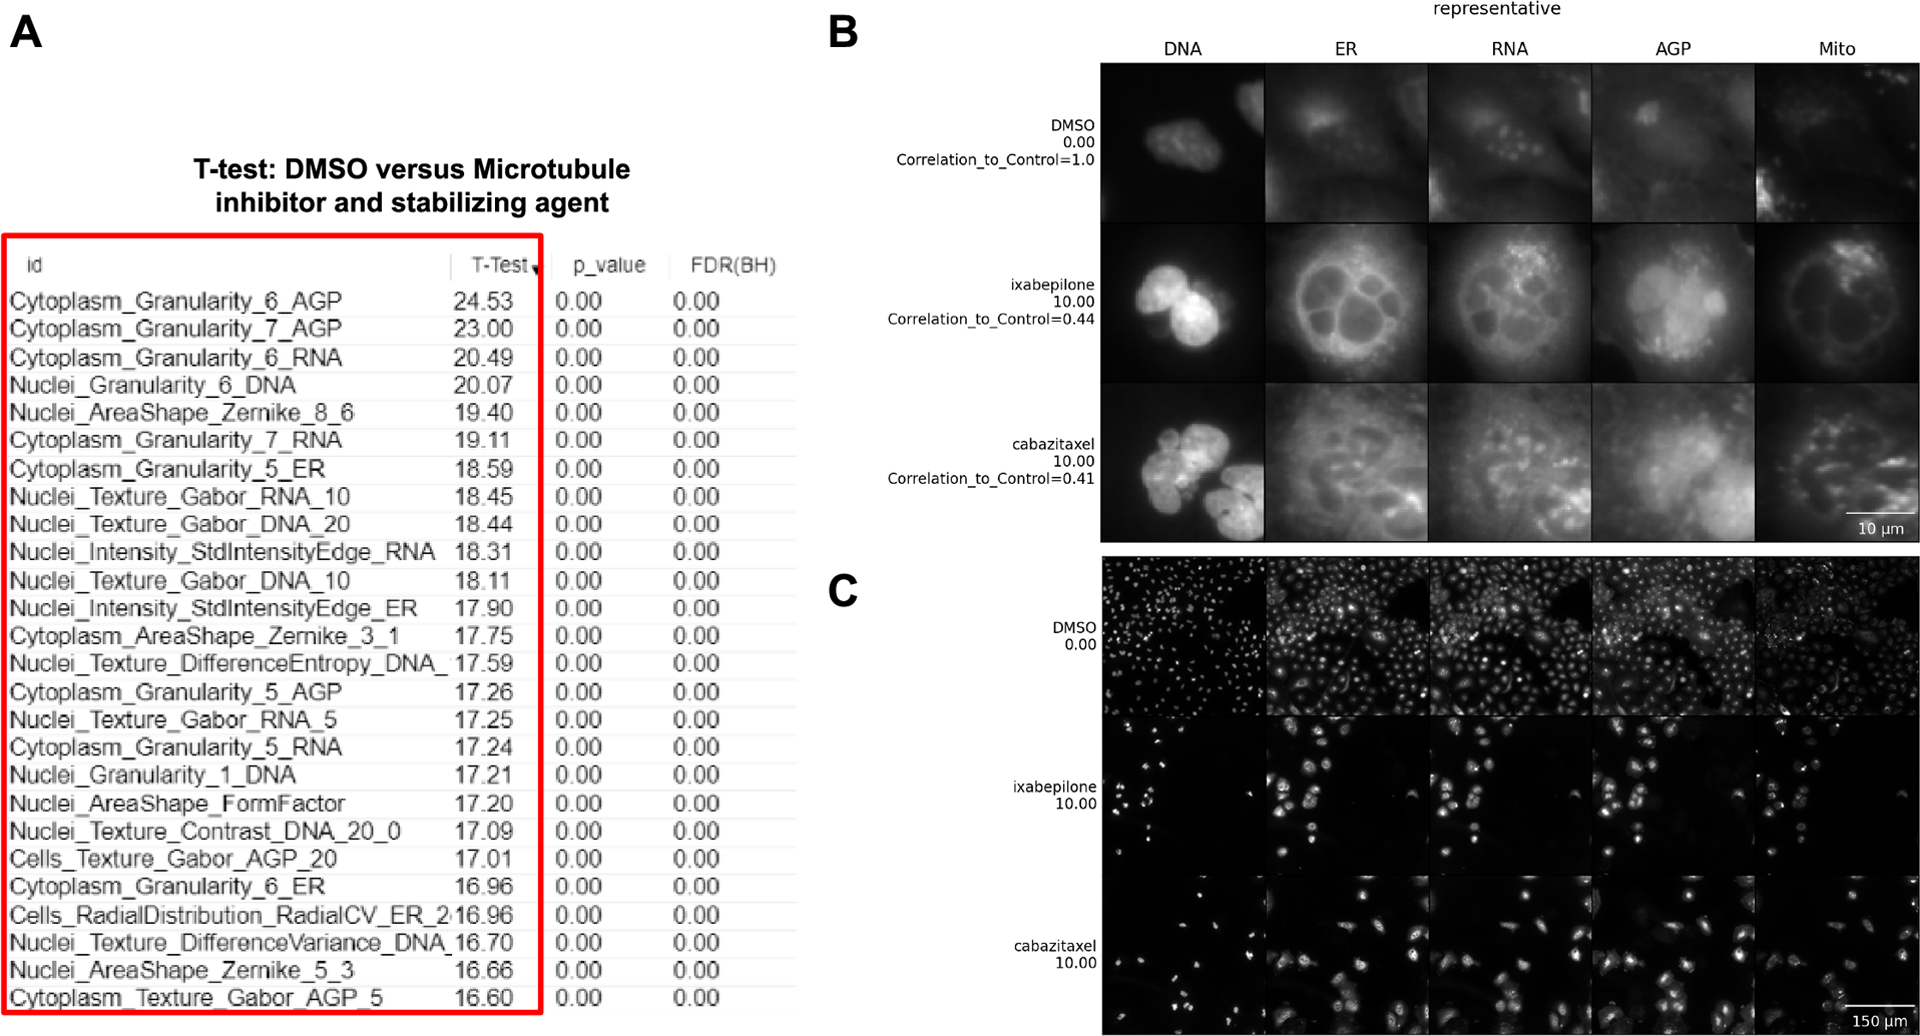
Figure 6 -.

Interpretation of data using our Basic Protocols 1 and 2. (A) A marker selection was performed to test what are the features that differentiate DMSO vs Microtubule inhibitors (cabazitaxel 10 μM) and Microtubule stabilizing agents (ixabepilone 10 μM). The red box highlights the features. (B) Single cells are cropped based on an algorithm to retrieve representative cells. Scale bar = 10 μm. (C) Field-of-view where representative single cells are located. DNA (nucleus stained with Hoechst 33342, excitation/emission 405/450 nm), ER (endoplasmic reticulum stained with Concanavalin A, excitation/emission 488/525 nm), RNA (nucleoli and cytoplasmic RNA stained with SYTO 14, excitation/emission 488/600 nm), AGP (actin stained with phalloidin, Golgi and plasma membrane stained with wheat germ agglutinin, both acquired with excitation/emission 561/600 nm), and Mito (mitochondria stained with MitoTracker Deep Red, excitation/emission 640/750 nm). For complete details about the Cell Painting procedure, see more at (Bray et al., 2016). Scale bar = 150 μm.
