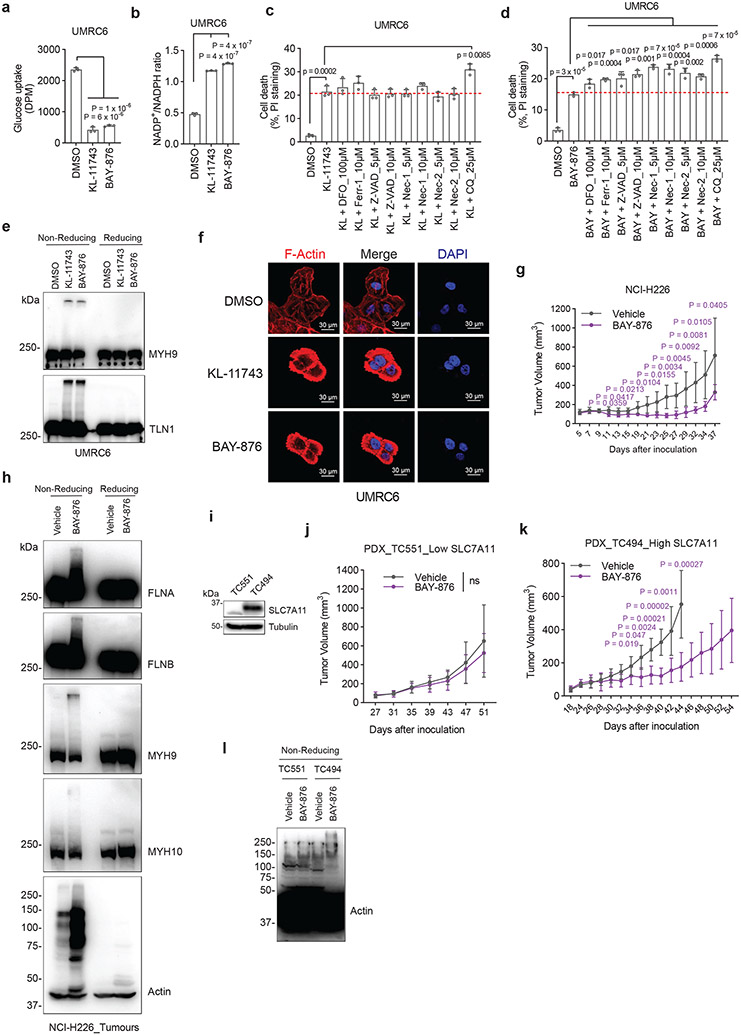
Figure 6. GLUT inhibitors induce disulfidptosis in SLC7A11high cells.
a, b, Glucose uptake levels (a) and NADP+/NADPH ratios (b) in UMRC6 cells treated with vehicle DMSO, 5 μM KL-11743, or 5 μM BAY-876 for 2 hours. c, d, Cell death measured by PI staining in UMRC6 cells treated with vehicle DMSO, 5 μM KL-11743 (c), or 5 μM BAY-876 (d) with or without co-treatment with deferoxamine (DFO), Ferr-1, Z-VAD, Nec-1, Nec-2, and CQ at indicated concentrations for 7 hours. e, Non-reducing and reducing Western blotting analysis of MYH9 and TLN1 in UMRC6 cells treated with vehicle DMSO, 5 μM KL-11743, and 5 μM BAY-876 for 3 hours. f, Fluorescent staining of F-actin with phalloidin in UMRC6 cells treated with vehicle DMSO, 5 μM KL-11743, and 5 μM BAY-876 for 4 hours. Nuclei were stained by DAPI. g, Tumour volumes of NCI-H226 xenografts with indicated treatments over time. Data are mean ± s.d., n = 6 mice. h, Non-reducing and reducing Western blotting analysis of NCI-H226 tumours with indicated treatments. i, Western blotting analysis of SLC7A11 protein levels in indicated PDX models. j, k, Tumour volumes of TC551 (j) and TC494 (k) PDX model with indicated treatments over time. Data are mean ± s.d., n = 8 mice. l, Non-reducing Western blotting analysis of actin in PDX tumours with indicated treatments. All P values were calculated using two-tailed unpaired Student t-test. Data are mean ± s.d., n = 3 independent repeats unless specified. ns: not significant (P > 0.05). All Western blotting was repeated at least twice, independently, with similar results.

