Figure 2.

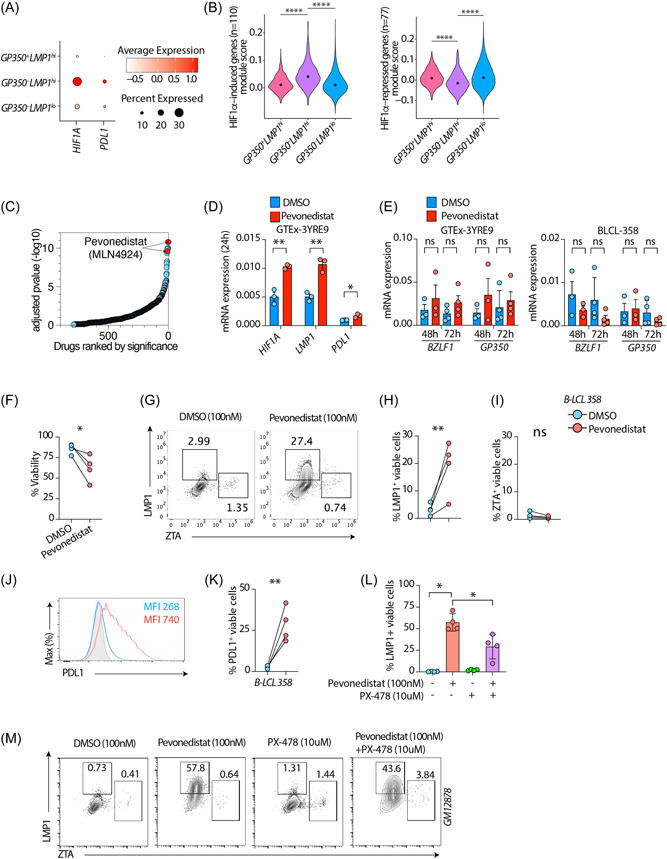
GP350–LMP1hi LCLs have a HIF1A‐associated signature. (A) mRNA expression of HIF1A or CD274 genes across all clusters as dot plot. (B) Module scores of HIF1A induced genes (left panel) or HIF1A‐repressed genes (right panel). HIF1A induced and repressed genes are sourced from MSigDB (M1308). ****p < 0.0001 by two‐tailed Wilcoxon rank‐sum test. (C) Enrichr based drugs predicted (out of 906 total drugs) to counteract genes induced in GP350–LMP1hi LCLs compared to other cells, ordered by adjusted p value. Drugs are sourced from Enrichr library “Drug_Perturbations_from_GEO_down.” (D, E) mRNA expression of indicated host (E) or EBV (E) genes in LCLs treated with 100 nM DMSO or Pevonedistat. UBC was used as a housekeeping gene. (F–K) Flow cytometry on BLCL‐358 treated with 100 nM DMSO or Pevonedistat for 72 h. Plots showing cell viability and LMP1, BZLF1, or PDL1 expression in LCLs treated with DMSO or Pevonedistat. Shown are cumulative %viability plots (F), representative flow cytometry plots (G) and cumulative data showing %LMP1+ (H) and %BZLF1+(I) in gated live LCLs. (J, K) Representative PDL1 expression as mean fluorescent intensity or cumulative %PDL1+ in gated live LCLs. (L, M) Flow cytometry on GM12878 LCLs treated with indicated drug combination for 72 h. PX‐478 treatments were done 1 h before Pevonedistat treatments. Plots showing cumulative LMP1+ (l) or representative flow cytometry plots (M) in gated live cells. Data in (D–M) are from n = 3 or n = 4 independent experiments; gating strategy is shown in Supporting Information: Figure S2D. *p < 0.05; **p < 0.01; ***p < 0.001; ****p < 0.0001 by two‐tailed paired ratio t‐test. EBV, Epstein‐Barr virus; LCL, lymphoblastoid cells.
