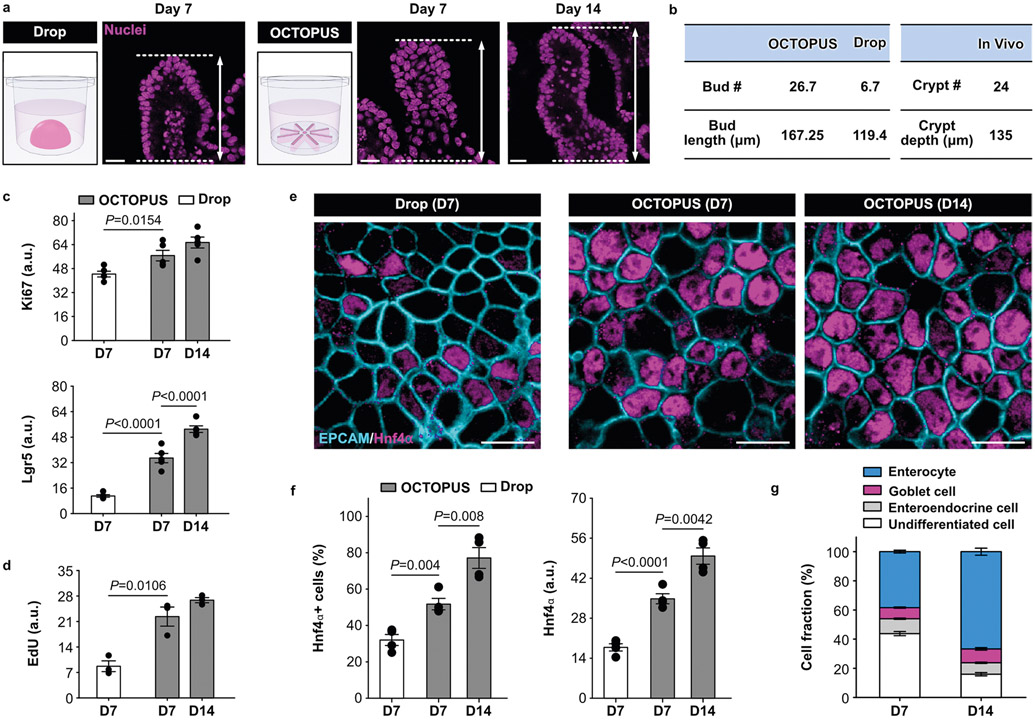
Extended Data Fig. 4 ∣. Maturation of intestinal organoids in OCTOPUS.
a. Comparison of bud length. Confocal micrographs show the cross-section of buds extending from the main body of the organoids. In each image, the white dashed lines indicate the approximated positions of the base and tip of a bud. Organoids in OCTOPUS generate more elongated buds. Scale bars, 20 μm. b. Comparison of the number and size of organoid buds in vitro to those of mouse intestinal crypts in vivo. c, d. Quantification of Ki67, Lgr5, and EdU expression in mouse intestinal organoids (n = 5 and 3 biologically independent experiments for (c) and (d), respectively). e. Organoids developing in OCTOPUS exhibit increased expression of Hnf4α, a marker of mature intestinal epithelial cells, compared to the control group in Matrigel drop. Scale bars, 10 μm. f. Quantification of the fraction of Hnf4α+ cells and the level of Hnf4α expression. Immunofluorescence of Hnf4α was normalized with respect to the number of cells (n = 4). g. The graph shows the cellular composition of the intestinal epithelium in OCTOPUS. Quantification was performed by measuring the immunofluorescence of cell type-specific markers described in Fig. 2m. Undifferentiated cells were identified by positive DAPI staining without the expression of differentiation markers. The data indicate the abundance of enterocytes (79% of the differentiated cell population at day 14) (n = 3). All data are presented as meant SEM and P values are from unpaired, two-sided t test.

