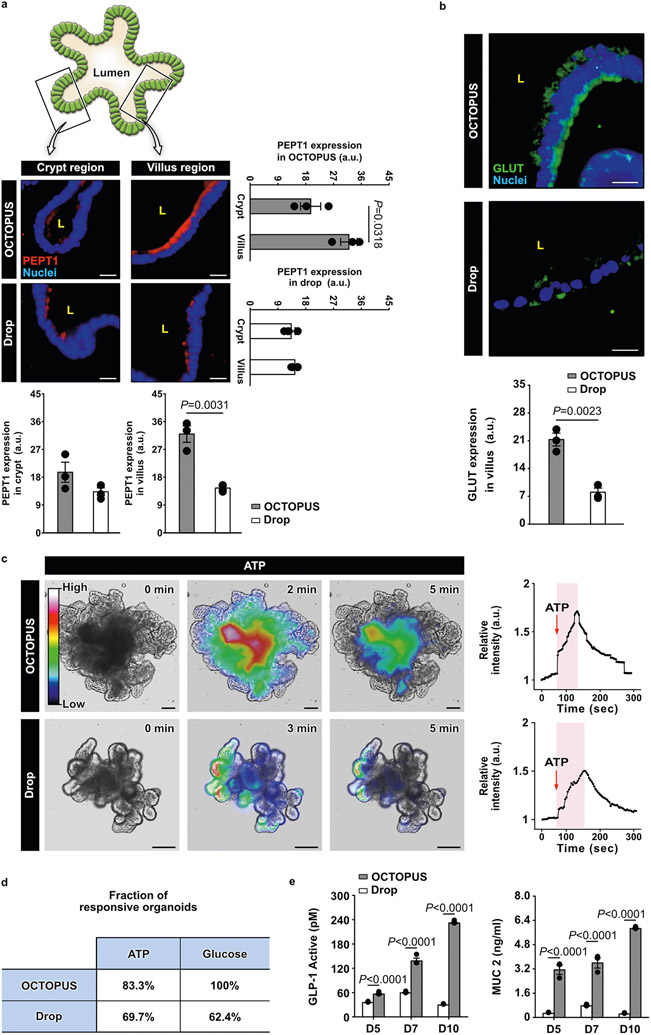
Extended Data Fig. 6 ∣. Functional characterization of intestinal organoids in OCTOPUS.
a. Immunofluorescence analysis of PEPT1, a nutrient transporter responsible for intestinal uptake of peptides. In this analysis, organoids in Matrigel drops at the maximum duration of culture (7 days) were compared to those maintained in OCTOPUS for 14 days to examine the contribution of extended culture. Organoids in OCTOPUS exhibit robust immunostaining of PEPT1 predominantly in the villus domain of the organoids. PEPT1 expression in this region is restricted to the apical surface of the epithelium facing the organoid lumen (L), matching the localized distribution of PEPT1 on the brush border membrane of the native intestinal epithelium. This polarized expression of PEPT1 is also observed in the villus surface of the organoids in Matrigel drop culture but the level of expression is significantly lower than that in OCTOPUS. Scale bars, 20 μm. b. Comparison of GLUT immunofluorescence in the villus domain of organoids. GLUT is ex-pressed on both the apical and basal surfaces of the villus epithelium in OCTOPUS. This trans-porter is also present in drop culture but its immunofluorescence is much weaker. Scale bars, 20 μm (n = 3 biologically independent experiments). c. Imaging and quantification of intracellular calcium signaling in intestinal organoids treated with 100 μM ATP. in the plots of relative intensity, the time between organoid stimulation and maximum fluorescence intensity is shaded in pink. Data were normalized to fluorescence intensity at the initial time point (t = 0 min). Scale bars, 100 μm (n = 3). d. Fraction of responsive organoids. The fraction of organoids that respond to ATP and glucose stimulation is larger in OCTOPUS. e. ELISA analysis of an active form of GLP-1 and MUC2 secreted by intestinal organoids. Both analytes are produced in significantly higher concentrations in OCTOPUS, which also continue to increase over time during extended culture (n = 3 biologically independent experiments). All data are presented as mean ± SEM and P values are from unpaired, two-sided t test.

