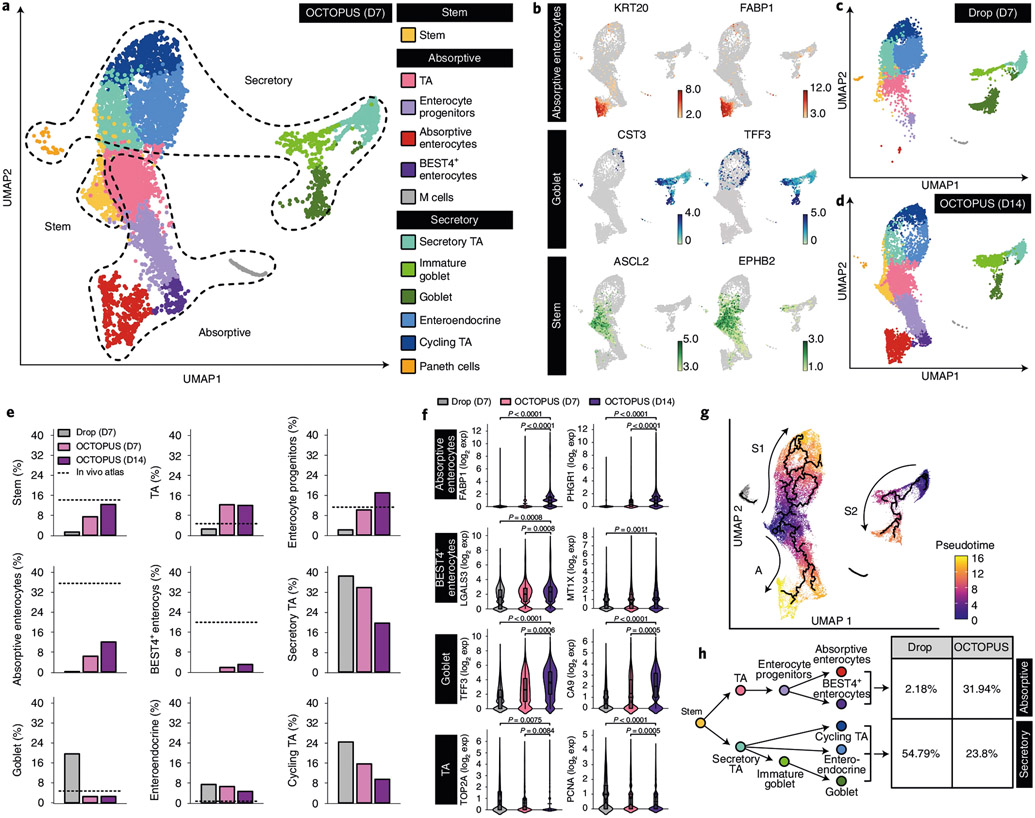
Fig. 4 ∣. scRNA-seq of human enteroids in OCTOPUS.
a, UMAP projection of 12 clusters representing distinct stem and intestinal epithelial cell populations in human enteroids produced by 7 d of culture in OCTOPUS. b, UMAP plots showing the expression of representative canonical genes specific to absorptive enterocytes, goblet cells and stem cells in log2 expression values. c,d, UMAP projection of cell clusters in human enteroids after 7-d culture in Matrigel drop (c) and 14 d of uninterrupted culture in OCTOPUS (d). e, Quantification of cellular compositions in human enteroids. Where available, the percentage of each cell type in the native human intestine was obtained from published in vivo atlases and shown with a dashed line. f, Violin plots comparing the expression of select cell-type-specific maturation markers between Matrigel drop culture and OCTOPUS. Violin plot elements showing unique molecular identifier (UMI) counts per cell represent the following values: center line, median; box limits, upper and lower quartiles; whiskers, 1.5-fold the interquartile range (n = 9,477 cells for Drop D7, 8,596 cells for OCTOPUS D7 and 1,1031 cells for OCTOPUS D14 examined over 3 independent experiments). g, Pseudotime trajectories (top) and branching plot (bottom) of intestinal stem cell differentiation into secretory and absorptive cell populations in human enteroids cultured in OCTOPUS for 14 d. h, Comparison of the fractions of differentiated epithelial cell types in OCTOPUS and Matrigel drop culture. All data are presented as mean ± s.e.m. and P values are from unpaired, two-sided t-test. exp, expression; M, microfold; TA, transit-amplifying.

