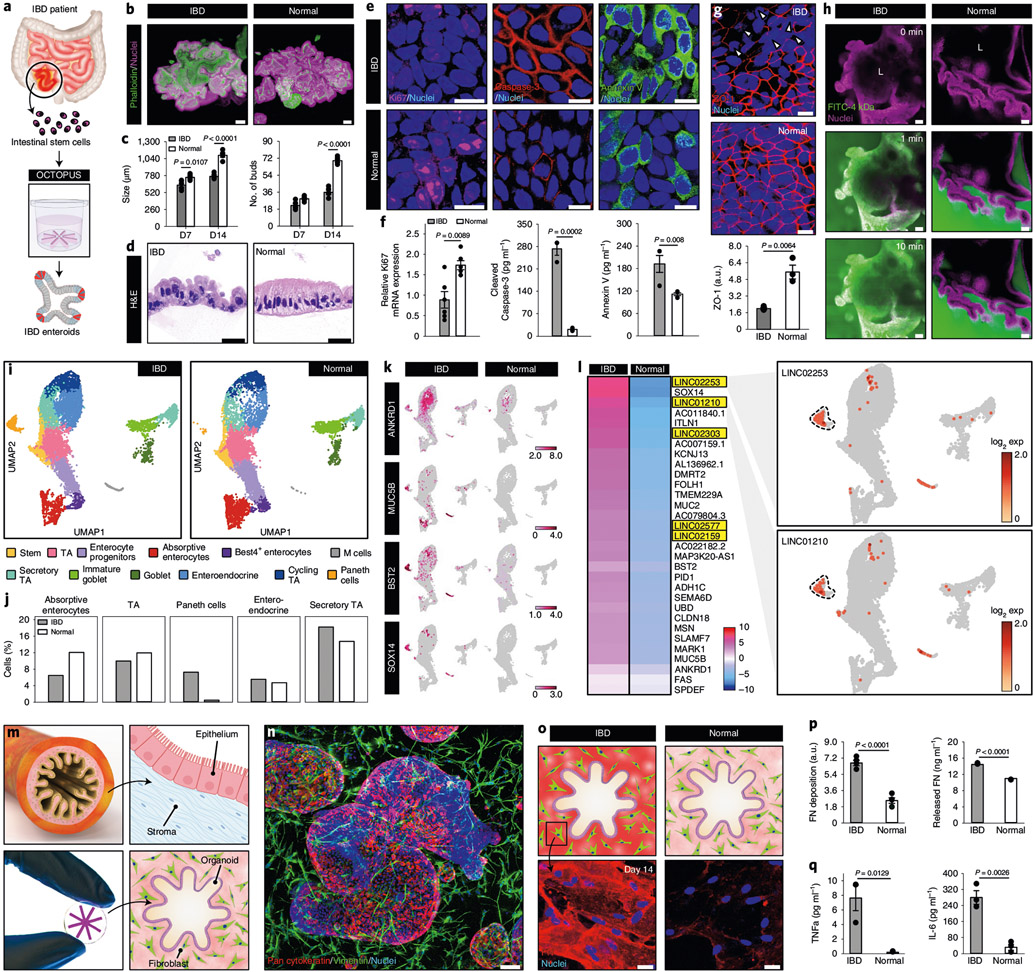
Fig. 5 ∣. Organoid-based model of human IBD in OCTOPUS.
a, Adult stem cells isolated from the intestine of patients with Crohn’s disease are used to form enteroids in OCTOPUS. b, Morphology of IBD and normal enteroids in OCTOPUS after 14-d culture visualized by immunofluorescence. Scale bars, 100 μm. c, Quantification of enteroid size and the number of buds at days 7 and 14 (n = 5). d, Histological sections of the intestinal epithelium after 14 d of culture. Scale bars, 5 μm. e,f, Immunofluorescence (e) and quantification (f) of cell proliferation (Ki67) (n = 6) and apoptosis (caspase-3 and annexin V) (n = 3) in IBD and normal enteroids. Scale bars, 10 μm. g, Confocal micrographs and quantification of ZO-1 expression in the villus domain of enteroids. Scale bars, 10 μm (n = 3). h, Visualization of 4-kDa dextran-FITC diffusion into the organoid lumen (L) to show epithelial permeability in the IBD enteroids. Scale bars, 50 μm. i,j, UMAP projection of distinct cell populations (i) and quantification of their proportions (j) in IBD and normal enteroids. k, Comparison of IBD-associated genes in log2 expression values. l, Heatmap showing the mean expression of transcription factors in IBD enteroids relative to that in normal enteroids. Upregulation of lncRNA genes in the IBD enteroids occurs mostly in Paneth cells shown with dashed lines in the UMAP plots. m, Coculture of human enteroids and primary human intestinal fibroblasts in OCTOPUS. n, Confocal micrograph of the coculture construct at day 14. Scale bar, 100 μm. o, Immunofluorescence micrographs of localized regions surrounding the enteroids after 14 d of culture. Scale bars, 25 μm. p, Quantification of FN production (n = 3). q, Quantification of cytokines (n = 3). All data are presented as mean ± s.e.m. and P values are from unpaired, two-sided t-test. ZO-1, Zonula occludens-1.

