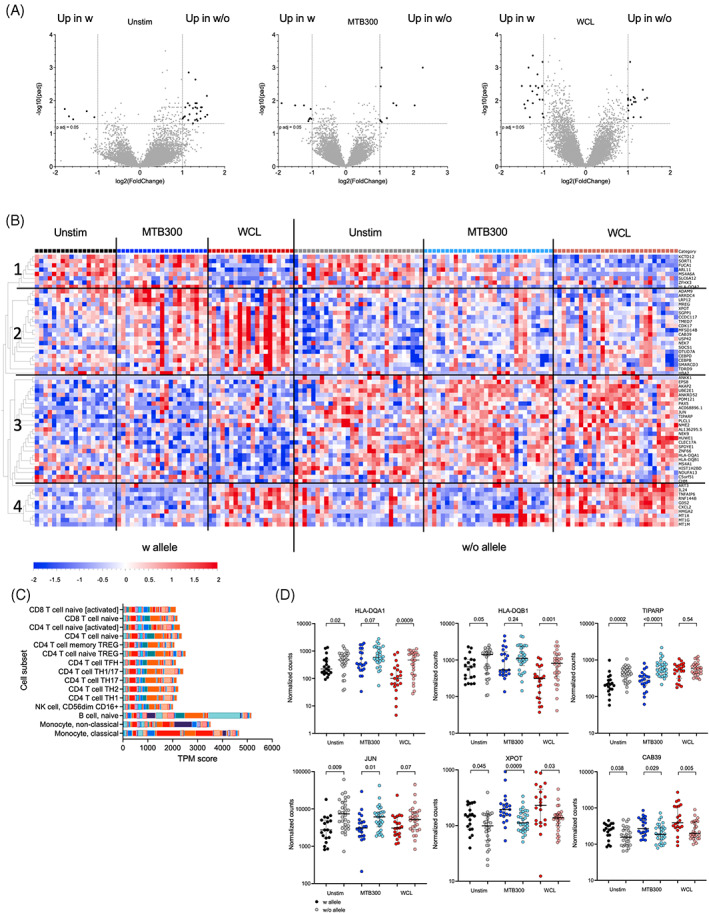
FIGURE 2.

Expression of the susceptibility alleles is associated with a specific gene signature. (A) Volcano plots showing differentially expressed genes comparing individuals with susceptibility alleles (n = 21) to those without (n = 30) in three different stimuli conditions; unstimulated, MTB300, and WCL. Black indicates DEGs (adjusted p value <0.05 and log2 fold change >1 and < −1). (B) Heatmap displaying the 63 DEGs from (A). Genes are ordered by hierarchical clustering, and samples are ordered according to allele expression and then according to stimulation condition. Black vertical lines indicate allele and stimuli separation and horizontal lines indicate cluster separation. (C) Cell‐type enrichment (http://dice‐database.org) for the 63 DEGs. Each color represents one gene. (D) Gene expression at the mRNA level. Gene expression values in counts normalized by sequencing depth calculated by the DEseq2 package. Two‐tailed Mann–Whitney U test.
