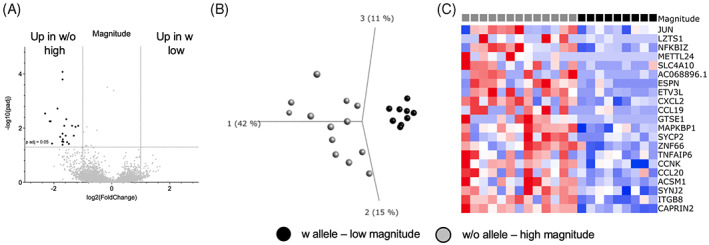
FIGURE 3.

Differences in Mtb‐specific magnitude of response is associated with a specific gene signature. (A) Volcano plot showing differentially expressed genes comparing individuals with susceptibility alleles and low magnitude of expression (n = 9) to those without and high magnitude of expression (n = 13) in unstimulated samples. Black indicates DEGs (adjusted p‐value <0.05 and log2 fold change >1 and < −1). (B) PCA plot illustrating differences between the two cohorts for the 21 DEGs. (C) Heatmap displaying the 20 DEGs from (A). Genes are ordered by hierarchical clustering, and samples are ordered according to the two cohorts.
