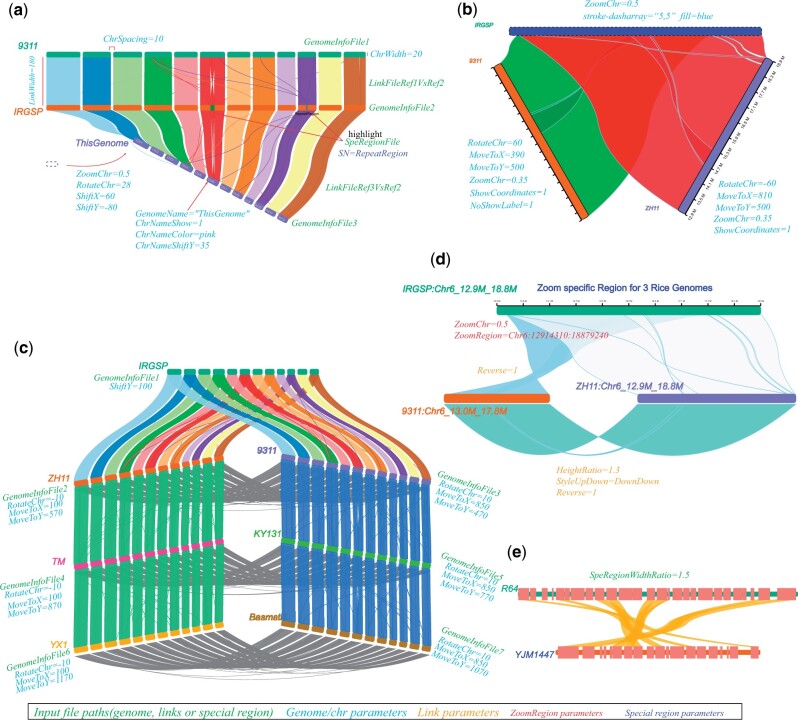
Figure 1.
Customizing plots generated by NGenomeSyn. (a) General parameters for input files and attributes for genomes, links, and genomic special regions. (b) Triangular layout of three genomes. (c) A complex layout of seven genomes. (d) Syntenic regions of zooming in on given regions in three genomes. (e) Customizing height and color for special feature (e.g. CDS) in given regions of two yeast genomes. Colorful italic texts indicate parameters for input, genomes, special genomic regions, and links. Rice datasets were used to generate figures in panel a–d. Yeast datasets were used to generate figure in panel e.

