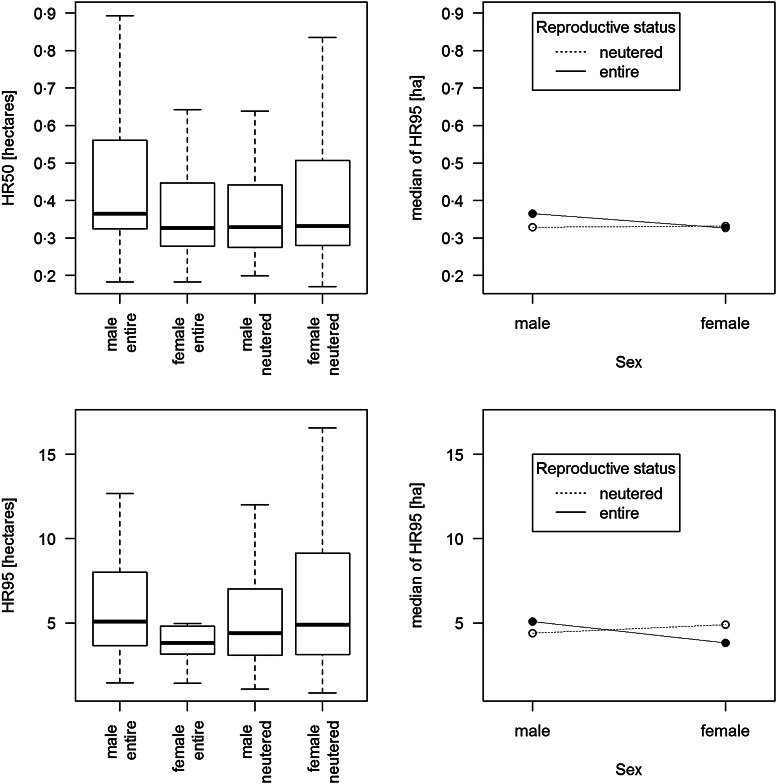
Fig. 2.
Boxplots and interaction plots of the core (HR50, top line) and extended (HR95, bottom) home ranges of 200 observations from 135 dogs from Aboriginal communities in Northern Australia, depending on their sex and reproductive status. Outliers are not shown. Data were collected between September 2013 and June 2015.

