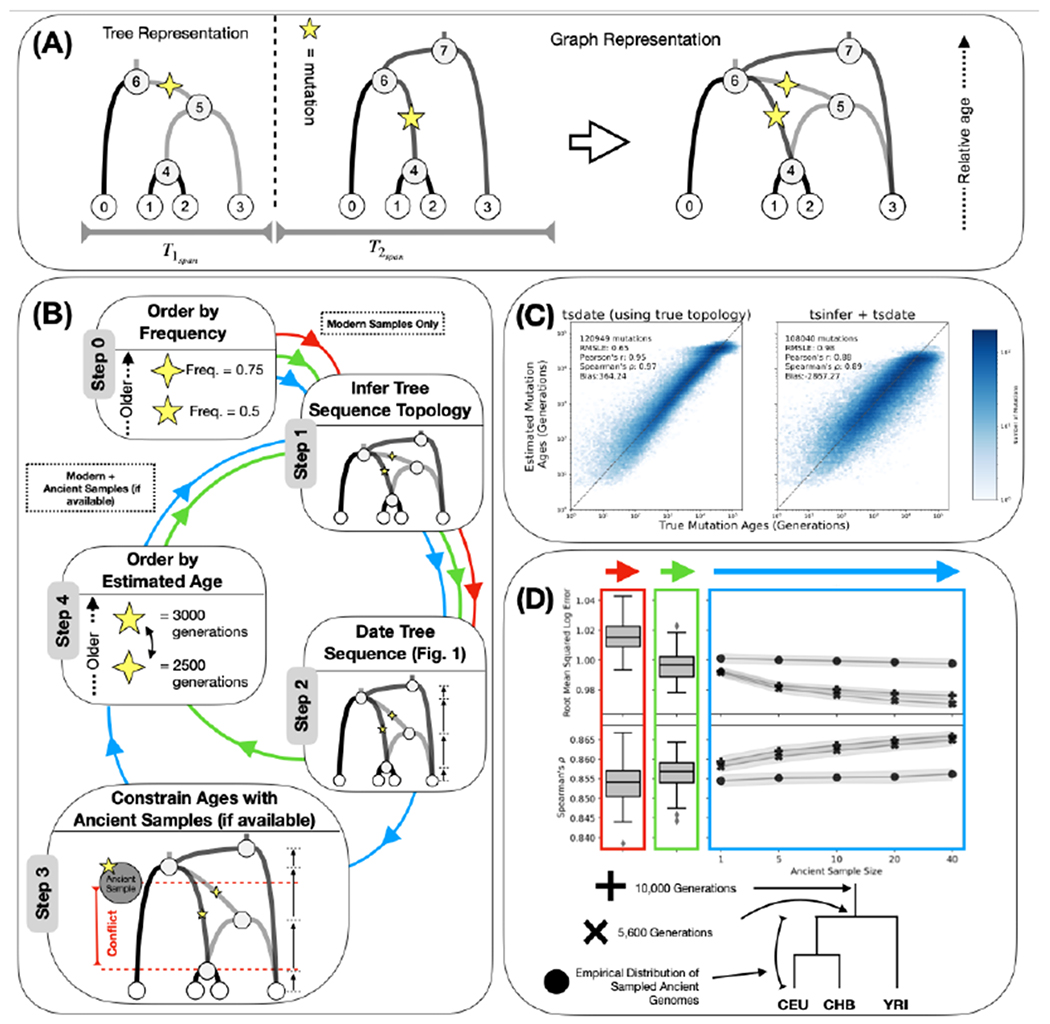
Fig. 1. Schematic overview and validation of the inference methodology.

(A) An example tree sequence topology with four samples (nodes 0-3), two marginal trees, four ancestral haplotypes (nodes 4-7), and two mutations. Tspan measures the genomic span of each marginal tree topology, with the dotted line indicating the location of a recombination event. The graph representation is equivalent to the tree representation. (B) Schematic representation of the inference methodology. Step 0: alleles are ordered by frequency; the mutation represented by the four-point star is considered to be older. Step 1: the tree sequence topology is inferred with tsinfer using modern samples. Step 2: the tree sequence is dated with tsdate. Step 3: node date estimates are constrained with the known age of ancient samples. Step 4: ancestral haplotypes are reordered by the estimated age of their focal mutation; the five pointed star mutation is now inferred to be older. The algorithm returns to Step 1 to re-infer the tree sequence topology with ancient samples. Arrows refer to modes of operation: Steps 0, 1 and 2 only (red); Steps 0, 1, 2, 4, 1, and 2 (green) and Steps 0, 1, 2, 3, 4, 1, 2 (blue) (24). (C) Scatter plots and accuracy metrics comparing simulated (x-axis) and inferred (y-axis) mutation ages from msprime neutral coalescent simulations, using tsdate with the simulated topology (left) and inferred topology from tsinfer (right). (D) Accuracy metrics, root-mean squared log error (top) and Spearman rank correlation coefficient (bottom), with modern samples only (first panel), after one round of iteration (second panel) and with increasing numbers of ancient samples (colored arrows as in panel B). Ancient samples from three eras of human history are considered as in the schematic (24).
