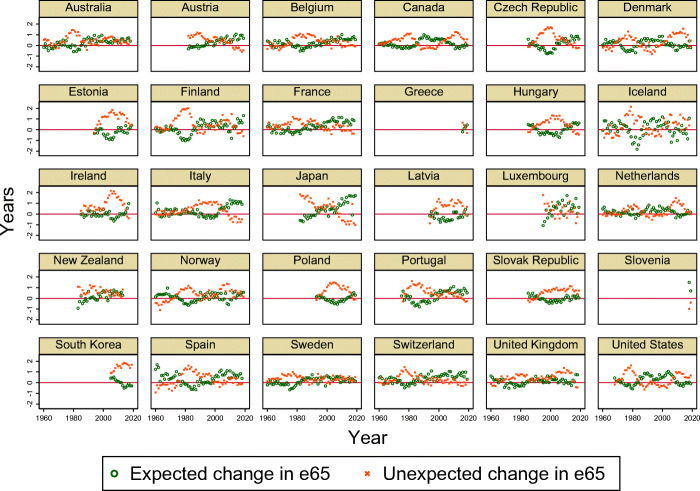
Fig. 7.
Expected and unexpected components of changes in life expectancy at age 65. Notes. The change in life expectancy at age 65 from year t − 5 to t are decomposed such that , where the first term is the unexpected component and the second term is the expected component. The forecast of life expectancy 65 at t made 5 years ago () is obtained by applying the Lee-Carter model to past 30 years of age-specific mortality rates. Mortality rate data are from the Human Mortality Database except South Korea, for which we use data from Statistics Korea. See Section 4.1 for more details

